It started as simple sales reporting. It is no longer simple. In 2005, there were five consumer product leaders actively using downstream data (retail inventory and sales data). Today, over 80% of consumer products companies greater than 1 billion in revenue are redefining work processes to use it. The space is murky. It is not easy, and it is evolving. However, the deeper teams explore the usage of the data, the more excited they get. This has been FUN to watch.
One of the things that you get to do as an analyst is name things. We get to put OUR stamp –usually a cool three-letter acronym—on new technologies, processes and trends. (At least, we think that it is cool.) I am one of the mother’s of the Demand Signal Repository (DSR) term. It was originally defined by Kara Romanow, now Executive Editor at Consumer Goods Technology (CGT). I was an early collaborator with Kara. It took shape and form from my fingertips as I wrote about the usage of downstream data in consumer value networks. I have followed the market for the past six years. Kara and I like to joke, that we were both mothers in the genesis and market acceptance of the term DSR.
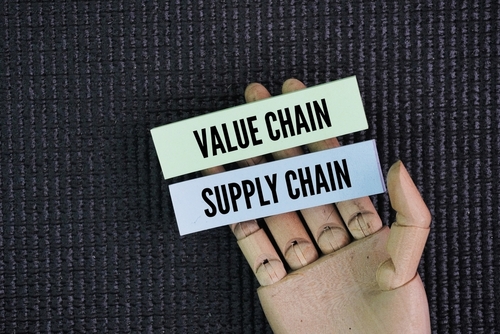
A DSR is a repository of demand information. Demand information comes in many different forms—orders, shipments, syndicated data, point of sale information, warehouse withdrawal information from retailers, customer panel groups—and needs to be used by many different roles within the organization—sales for account reporting, marketing for promotional/new item acceptance and market share analysis, supply chain for forecasting and out-of-stock sensing, and R&D for new product launch insights. The problem is that everyone wants it in a different form—frequency, granularity, attributes—and the data processes of cleaning, harmonizing and synchronizing are messy requiring a strong understanding of the data.
Help me Get it Right
So, as one of the mother’s—some would even disdainfully say “muther“—of the term DSR, I have been thinking about the evolution of this market and the market drivers, and I wanted to get some community input. I am writing a report on market evolution and wanted to get community input on the evolution of the technologies. (One of the exciting aspects of Altimeter Group’s research model is open research with the community.) So, I welcome your feedback, do you think that these are the right trends?
Right Trends?
2010 will be the year of predictive analytics. The DSR is not the end state. The value of downstream data is the USAGE of the data into new business processes/work streams. Whether it is Vision Chain’s new sensing of out-of-stocks, or Terra Technology’swork on short life cycle product sensing. 2010 is the year of predictive analytics. Look for new applications to evolve. I predict exciting launches in the area of price and promotion compliance, market basket analysis, shopping patterns, damage, and category analytics. I find the convergence of loyalty data, point of sale information and geo mapping technologies very exciting to give live representations of market out-of-stocks, customer demand, and near real-time sensing of market trends.
In parallel, we will see market convergence of the technologies. There are just too many sales reporting applications in the market, and predictive analytics vendors will need a database structure to enable insights from harmonized, disparate data sources (E.g. Nielsen’s TDLinkx product, orders, shipments, syndicated data, point of sale, warehouse inventory levels, retail inventory levels, etc).
It won’t just be about modern trade. Hopefully, by now, it is clear to everyone that there has been a step change in data sharing by retailers in North America and Europe. No, not everyone is sharing data; but, the data that is being shared gets more significant, and better quality, each year. Customers that are working at getting the data now have 70% of North American and 30% of the European grocery markets. (The secret is knowing how to ask for it.)
As companies use downstream data for modern trade, they will use the techniques to build demand networks to tackle the challenge of emerging markets. The bullwhip effect of distributor relationships is just too painful. Consider the differences in table 1 for the food industry.
Table 1: Bullwhip effect
| Supply Chain Type | Demand Latency from Shelf to Order | Order Cycle Time | Manufacturing Cycle |
| Modern trade for warehouse distribution | 10-14 days | 3 days | 10-20 days |
| Emerging markets | 40-48 days | 1 day | 30-40 days |
| Food service | 24-35 days | 2-3 days | 30-40 days |
Leaders will build distributor networks (similar to Anheuser’s Budnet) as part of the infrastructure to capture market share in the evolving markets.
Differentiation will come from enrichment and the design of the information layer. To serve multiple roles and to enable new discovery, the secret sauce is the design of the information layer. It is not a traditional Master Data Management (MDM) problem. Instead, it requires flexible data assembly and quick data parsing. I believe that we will see the use of Search Engine Optimization (SEO) technologies like Endeca evolve to help companies solve this problem. (I saw some interesting evolutions of this concept in India past week.) In parallel, new content—store demographics, in-store shopping data, panel data—will evolve. These two elements will enable the true POWER from the new predictive analytics.
SAAS, License, Cloud.Initial forays into the usage of downstream data will be deployment neutral: a true toss-up between license and Software as Service (SaaS) models. However, as data enrichment and advanced predictive analytics evolve, the DSR will come behind the firewall. Similarly, as social media turns into social commerce, an information layer will evolve in the cloud for the value chain. This value chain information layer will enhance not replace the enterprise DSR.

Social Commerce will Power the Tipping Point. As power shifts from the retailer to the shopper, social media technologies will power social commerce business processes (the ability to buy, return, shop on mobile devices based on reviews, price and inventory levels). Channels will blur as we enter the hype cycle of social commerce. To power these applications Point of Presence (where is the shopper) will combine with Point of Sale (POS) to track the success of social CRM. The amplitude of the hype cycle will be immense—a mini dot.com era—but, it will be the tipping point for the usage of downstream data and the design of outside-in value network.
Evolution. Do I have it Right?
So, what do you think? Do I have it right? Will it look like figure 1? Let me know your thoughts. Your input will serve as foundational input to refine the models for the report that I am writing on downstream data technologies in August.
Until then…. The Supply Chain Shaman is happy to be back from a very fruitful trip to India, and will be busy with research and advisory calls this week on the east coast of the United States.