Feasibility (noun): The state or degree of being easily or conveniently done. (Oxford Dictionary)
In the 1990s supply chain planning was over-hyped. Then it was a new and promising technology category. The ride was wild and wooly. Hype ruled. A decade later, as companies added planners expecting dramatic improvements, the market entered the trough of disillusionment. The promise was not equal to reality.
As a result, software sales slowed. The growth of the supply chain planning technology market disappointed investors resulting in consolidation and the decline of best-of-breed solutions.
In parallel, Enterprise Resource Planning(ERP) providers introduced a new hype cycle. Termed ERP II by Gartner, the concept of integrated planning with tightly coupled ERP to Advanced Planning Systems (APS) was believed to drive higher value. Sadly, it did not. The inverse occurred. In this push, Oracle, SAP and INFOR became revenue market leaders in APS, but under-served the market in the delivery of innovation. Modeling capabilities and usability in these ERP solutions had lower business user satisfaction, and required more labor input. This would have been ok if there was value. The sad reality w as the escalation of costs and a reduction in the quality of plan output. In my opinion, in this journey, industry analysts and consultants were complicit. No one held the technology providers responsible.
There are several issues. One is the lack of clarity. In the words of my clients, “What Makes a Good Plan?” Answering this question is not easy. The industry does not have a definition. I have thought about this a lot; and overtime, my thoughts have evolved. In this post, I share to spark a dialogue.
Why Is Supply Chain Planning Important?
Why should you care? Today market turbulence abounds. Spiraling transportation costs, tariff shifts and increased expectations for customer service sparks new interest in supply chain planning. Operations complexity coupled with the rise in demand volatility increases corporate risk. (Reference Figure 1. The larger the bubble, the greater the risk.)
Outsourcing–procurement, manufacturing and transportation– decreased visibility and increased data latency. As a result, we introduced black holes into the supply chain. Additionally the move from regional to global supply chain management decreased visibility. Yet, companies continued to invest primarily in ERP systems.
Figure 1. Supply Chain Risk Drivers: A Comparison of Risk

Multi-tier supply chain systems evolved slowly in parallel over the last decade while most enterprises invested only on enterprise systems. New forms of data–telematics, GPS, weather, sensor data–could help, but these new forms of data do not easily fit into today’s supply chain solutions. Hence the conundrum for supply chain leaders of how to build end-to-end planning and evolve planning.
Do You Have A Good Plan?
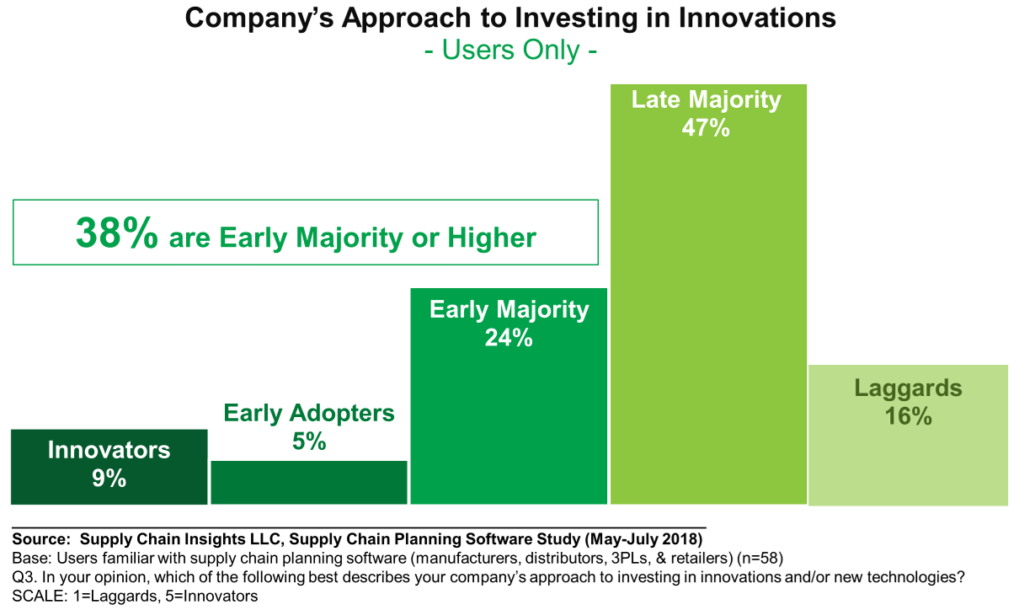
Today, supply chain planning is being redefined. The transition is slow. As shown in Figure 2, fewer and fewer companies are innovators (38%) and the skill level in the consulting market is lower than the past decade.
Figure 2. Tolerance of Supply Chain Leaders for Supply Chain Innovation
 The drivers? As market demands increase supply chain leaders want the same level of data usability that they have in their personal lives. New technology capabilities offer promise, but legacy supply chain planning providers are largely putting lipstick on an old pig. More and more business leaders are asking why, “The coalescence of machine learning, cognitive computing, software-as-a-service (SAAS), in-memory computing and better math offers cannot offer new possibilities?” The leaders do not know the answer, but are looking for solutions. In parallel, the supply chain planning technology leaders assume that they can ask business leaders to define new outcomes. It is a dilemma because they are uncertain. Business leaders are looking to technology providers to bring innovation to market.
As shown in Figure 3, one of the largest issues with today’s supply chain planning systems is production of a feasible plan. Companies want good plans, but they do not know how to define what good looks like.
Figure 3. Gaps in Supply Chain Planning
 Seven Ways to Measure a Good Plan
As I think about this issue, I recommend that companies start to measure five factors:
1) Time to Sense Market Shifts. The concept is to track how long it takes an organization takes to respond to market shifts. This is a measurement of demand sensing and overcoming demand latency. The way to measure this is to study sensing and translation by item type: new product acceptance, competitive activity and weather events.
2) Forecast Value Added. Forecast Value-Added (FVA) is a measurement of demand management improvement. This measurement adds discipline to the forecasting process by comparing the error and bias of the forecast as compared to the Naïve Forecast. (The Naïve Forecast baselines shipments of the past month to the current month.) Software from SAS has this as a standard measurement.
3) Forecastability: A measurement of the ease of forecasting. Forecastability is an analysis of what is possible in the forecast. Software like John Galt have this as a standard measurement.
4) S&OP Feasibility. The translation of the S&OP plan into execution. At this time, I have not seen this measurement in existing software. This would be a regular assessment of plan adoption into S&OP execution.
5) Schedule Adherence. The measurement of production planning to actual schedule. This is the most advanced in process industries in the OM Partners software.
6) Use of Spreadsheets. 68% of planning happens in spreadsheets. The high use of spreadsheets is an indication of a bad plan. The complexity of a supply chain precludes spreadsheet modeling. Work to drive plan adoption.
Figure 4. Use Of Spreadsheets Results in Excel Ghettos

7) Loads Tendered. Loads Accepted. In transportation planning, carriers are assigned by strategic bidding. The loads are usually assigned based on cost. The problem is that the acceptance of lanes by the carriers does not force the carrier to accept the freight when tendered. If the carrier does not accept the freight, the manufacturer loses time in moving the freight and is often forced to go to the open market to source freight. An effective measurement is loads tendered versus loads accepted.
Wrap-up
This does not mean that you should not measure typical measurements like error (MAPE, MPE or WMAPE), bias, cost or order fulfillment (on-time and full). Instead, these measurements should be plotted along with these seven parameters of planning to drive continuous improvement. For example, what is the impact of schedule adherence on cost? On customer service? What is the impact of FVA on custom service? Inventory levels? Slow and obsolete inventory?
These are my thoughts on the day before Thanksgiving in the United States. This is my 415 th post. I give thanks for my readers.
I look forward to your thoughts.
Relevant recent posts:
Five Things I have Learned About Global Supply Chain Planning
Five Reasons We Are Not Making Progress on Inventory Management
How Supply Chain Lost Its Mojo
Software Planning Satisfaction Is Like a Flip Of A Coin
Yowza! A Nine-Step Process for Selecting Supply Chain Planning
What Is Planning?