In Greek mythology, there is a difference between a Titan and a G od. A Titan was a primordial god born of Uranus and Gaea and ruled the earth until overthrown by the next generation, younger Olympian gods. The evolution sprung from chaos. Titans were born through brute strength and Gods drove more refined outcomes.
Supply chain leaders are competitive. The field of supply chain management—combining source, make and deliver into a common process— started in 1982. You can also argue that the genesis was chaos. Now in 2018, we are starting to see the evolution of “Gods” with new business models who are redefining supply chain processes. This includes Alibaba, Amazon, and Tesla. Yet, the Titans, the first generation of supply chain superpowers, continue to battle competitors.
The future of the Titans depends on delivering results. But how do companies best translate strategy into action? What choices drive the best results? My mission is to answer this question. Here I share some insights.
Preamble
Before I start, let me give a preamble. I am not a consultant. My focus is on research. The difference? Consultants know the answers while analysts seek the questions that business leaders should ask. Most companies, along with consultants, feel that they know the definition of supply chain excellence. Bandied-about terms like “best practices” and “supply chain leaders” fill the air at supply chain conferences. It is much like me throwing pancakes from the griddle on a Sunday morning. My caution is not so fast: 95% of companies are not making progress at the intersection of growth, operating margin, inventory turns and asset strategies. This is especially true for the Titans. As an avid student of supply chain performance, I have asked the question “What makes a “supply chain leader?” for the last six years. I have learned a lot, but I still have more questions than answers.
Figure 1: Supply Chain Metrics Are a Balancing Act
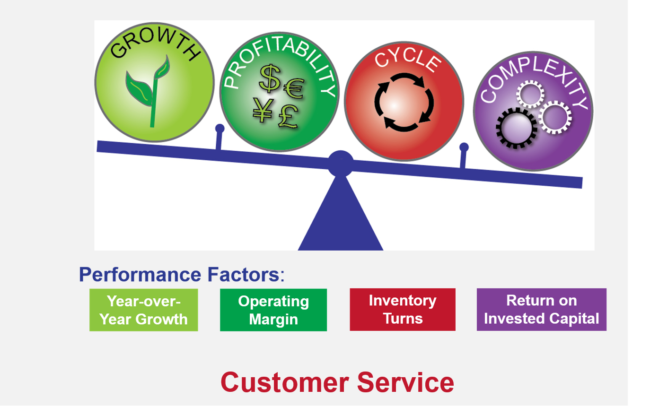
The supply chain is a complex, nonlinear system. Today it is more complex than a decade ago. Globalization, localization, and product portfolio complexity increased volatility. The metrics shown in Figure 1 are difficult to improve together. Most companies improve singular metrics but are not able to drive portfolio improvements. We find that when companies improve the portfolio, there is a positive correlation to market capitalization. However, it is easier to say than to do.
Defining a Titan
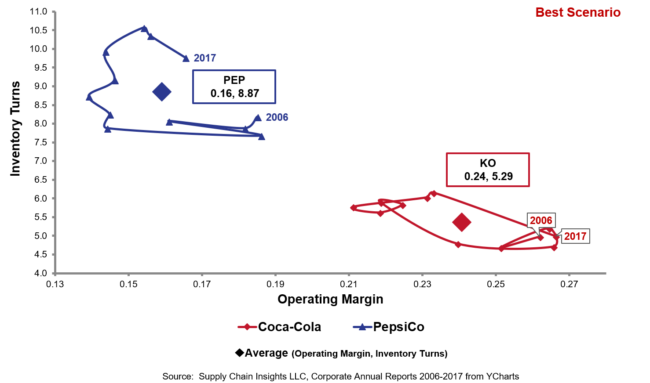
For this story, I have grouped like competitors together. Here I show orbit chart comparisons at the intersection of operating margin and inventory turns for the period of 2006-2017. (Consistent data is not available prior to 2006.) An orbit chart is the linking of data across years at the intersection of two metrics. When I started, I believed that all Titans were making progress towards improvement on the balanced scorecard. I was wrong.
The source of the data is public reporting of balance sheet information. I have chosen the metrics of operating margin (a measurement of profit) and inventory turns (the rate at which inventory turns based on revenue) to tell the story because I believe that these two metrics are within the direct control of a supply chain leader.
A titan for the purposes of my story is a company with strong brand recognition in the market and widely recognized by business leaders as a supply chain leader. The company could have pioneered practices, innovated with new technologies or demonstrated leadership in supply chain organizations. They are commonly viewed by supply chain practitioners as a supply chain leader.
Coca-Cola versus PepsiCo
Coca-Cola and PepsiCo pioneered the global distributor model for carbonated beverages. Pepsico has ceded profitability for inventory turns while Coca-Cola is at the same position in 2017 that the company was in 2006. Not much has changed. Overall profitability for Coca-Cola is 24% operating margin versus the average profitability for PepsiCo for the period at 16%. Pepsico average turns are 8.87 while Coca-Cola’s turns are less at 5.29. Neither Titan is making progress.
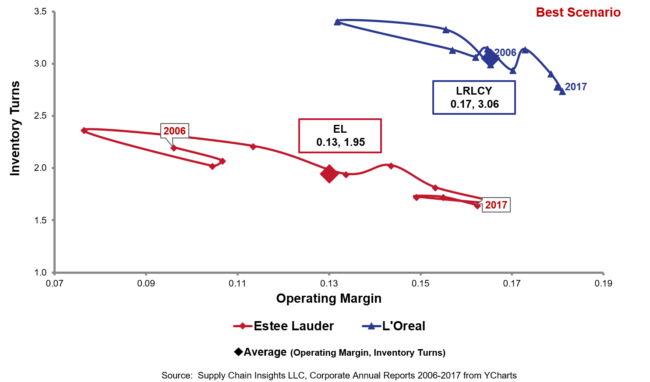
L’Oréal versus Estée Lauder
L’Oréal is one of my favorite supply chain leaders. I love the ownership at the business level of cost-to-serve, demand variability, and complexity. Year-over-year they have driven operating margin improvement while outperforming their peer group on inventory turns. Estée Lauder, with a 20% growth rate for the last seven years, is pushing to be a titan. Estée made solid improvement in margin but is losing ground on turns.
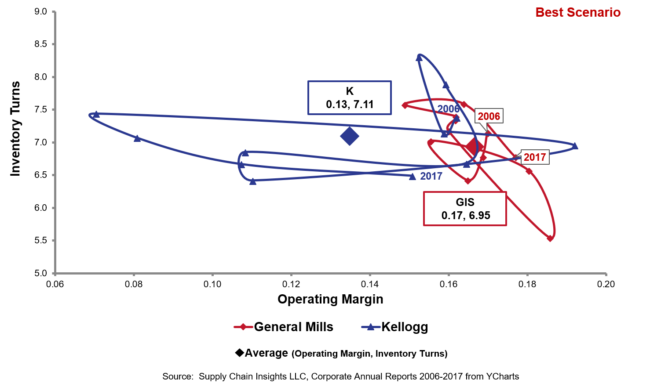
Kellogg versus General Mills
Neither of these two cereal giants read the market signals of the downturn in the consumption of prepared breakfast cereals. As a result, both have gone through major restructuring efforts over the course of the last five years. The results of General Mills are more resilient than Kellogg. While Kellogg has slightly better inventory turns, the business lacks the control of balance sheet results of General Mills. Kellogg is more functional than General Mills and has struggled with technology implementations. In the last decade, Kellogg implemented ERP badly three times (all with the same systems implementor) while General Mills is one of the best in the industry in the management of the implementation of new technology. The business and IT teams at General Mills are more closely aligned. General Mills average profitability is 17% whereas Kellogg’s is 13%. Both of these Titans are stuck.
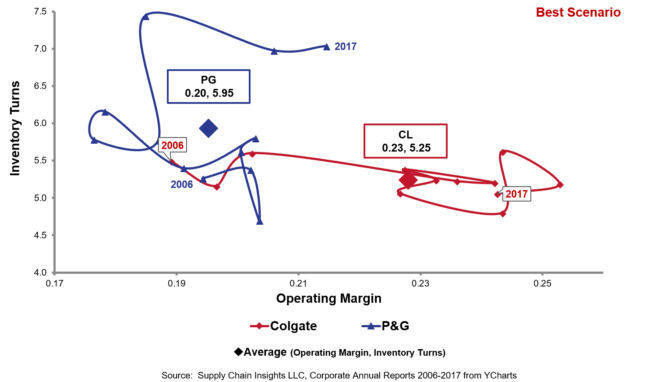
Procter & Gamble versus Colgate
Procter & Gamble (P&G) is an iconic supply chain titan and widely held to be a great supply chain leader. The company struggled through acquisitions to maintain profitability and operates at an asset utilization level below their peer group. The period of 2015-2017 following divestitures, hubbing of supply chain planning groups, and advancements in demand management capabilities demonstrates the characteristic of a titan (high inventory turns with progressively better operating margin). In contrast, Colgate outperforms P&G in margin, posting an average for the period of 23%, but lacks inventory capabilities posting inventory turns at 5.25. Both companies struggle to drive progress on a balanced scorecard.
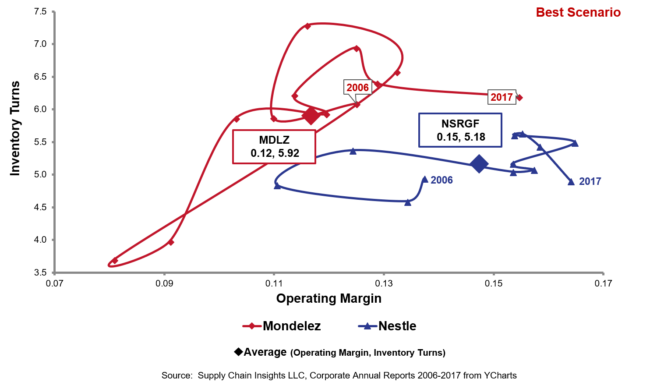
Nestlé versus Mondelēz
Mondelēz was born in this decade through a split with Kraft and a merger with Cadbury. The large pattern indicates a lack of resiliency. Nestlé’s results show continuous improvement. Nestlé outperforms Mondelēz in margin (15% versus 12%) while Mondelēz slightly outperforms Nestle in inventory turns. Nestlé is a stronger performer than Mondelēz.
Toyota versus Honda
Toyota is the iconic leader in Lean, penning the book “The Toyota Way.” The company lacked resiliency through the recession, losing ground on margin and regaining margin control in 2014-2017. In contrast, Honda has gone backward on margin, ceding ground to Toyota. Toyota outperforms Honda on inventory, 11 turns for Toyota versus 7 for Honda. Toyota is a stronger performer than Honda, but not a Titan.

Wrapping Up
So why should you care? New Gods are licking the Titans heels. Most titans are struggling to drive improvement. Still beverages are threatening the carbonated market. Honest Brands is taking market share from P&G. Amazon is taking share from Walmart. Tesla is threatening the automotive market.
Growth needs to be a goal for the supply chain leader. The traditional view of functional efficiency is a barrier for Titans to succeed. Most Titans are too wedded to the legacy technologies of ERP, APS, WMS, and TMS. These applications focus on functional efficiency and are not able to be a springboard to leapfrog the competition. While the Titans are evolving through maintenance upgrades, the Gods are redefining applications through the definition of new business models based on open source analytics and cognitive computing.
My point of view? We need to ask deeper questions on “what is possible” for supply chain analytics. The processes and technologies of the last decade cannot drive breakthrough performance.
I would love to hear from you, and have you join us at the Supply Chain Insights Global Summit on September 4-7, 2018 in Philadelphia. I think it is time to think differently and drive new outcomes. We need to learn from the paths of the Titans and embrace the new ways of working of the Gods.


Is your Supply Chain AI Ready?
A simple quiz to assess an organization’s AI readiness.
The pace of change is fast and furious. Every day, technology advances faster than we can digest. A great challenge to have.
Determining whether a supply chain is “AI-ready” is less about technology and more about the gray matter between the ears of supply chain leaders. Leadership, alignment, and clarity of goals matter.
Too few companies are clear on the definition of supply chain excellence. Measuring and rewarding functional metrics reduces the firm’s value. Putting agentics on top of today’s processes can make bad practices run faster, reducing value.
The toughest job for the supply chain leader is challenging existing supply chain paradigms that were defined by the limitations of decades of supply chain technologies. As the curtain lifts on the potential of new forms of technology, process redefinition is our opportunity, but only if we are clear on what drives value. (Here, I link to the Supply Chains to Admire reports to help you define value. The next report will be published on June 23rd, along with my Dynamic Benchmarking Product, to help you define value in the face of your AI readiness. More information about the launch is at the bottom of this blog.)