On Friday, I presented an overview of outside-in planning to a consulting group. I love the questions when I present. The reason? The dialogue helps me to think more deeply to explain the concepts.
Today, I am again teaching an open class on outside-in planning concepts. Over the next five weeks, seventy business/technology and consulting leaders will complete the course. I am attempting to provide a safe space for leaders to work together on a topic that is new and evolving. Here I provide a Q&A from the session on Friday.
1. Can you describe the outside-in model?
Figure 1 defines the layers of outside-in planning. In today’s training class, we focused on determining the balanced scorecard. Based on the work with Georgia Tech, we are getting clear on which metrics matter by industry to drive value. The goal is to move from a cost-driven functional agenda to a balanced metrics system that drives improved value.
As companies adopt a balanced scorecard, the traditional functional metrics shift to a focus on reliability. (For example, in manufacturing, the shift is away from OEE to focus on first pass yield and schedule adherence.) The layers of the outside-in process surround the traditional supply chain planning applications shown in the center of the model in blue.
Figure 1. Outside-in Planning Taxonomy
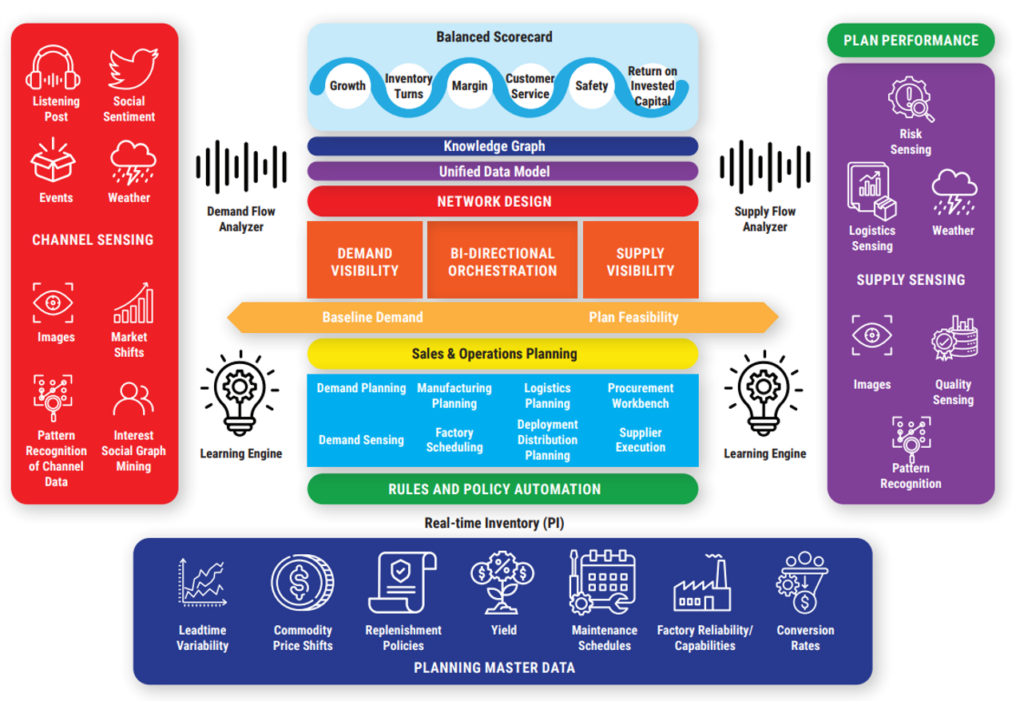
While I am sure that other models will evolve, this is the one I am actively testing.
In the outside-in process the focus shifts from sell-in to sell through the channel. This shift is fundamental changing processes and flows.
2. Who does it best?
It might seem unlikely, but the American Red Cross is a leader in defining a market-driven supply chain using outside-in signals. The company aligns channel requirements with available donors and successfully drives bi-directional orchestration programs to manage the reverse bill of materials (think about the balance between red cells and plasma). The non-profit drives demand-shaping campaigns to convince the right donors to give at the blood drives based on inventory levels. Seven elements drive success:
- Clarity. The team is clear on the mission. Their goal is clear–stabilize the blood supply in the United States. They implemented a simple planning technology with an outside-in channel-centric model (Ship to model definition).
- Market Signals. The team senses market shifts weekly, and the organization understands the impact of weather, disasters and disease on blood requirements (custom work).
- Bi-directional Orchestration. The group aligns the process on 22 blood traits and drives bi-directional orchestration decisions in S&OP across the traits for plasma/red and blood types to ensure supply.
- Minimal Latency. Due to the short lifecycle of the product and clarity of the mission, they have little process latency.
- Clear Perpetual Inventory Signal. The implementation of NoSQL for inventory management gives them an inventory signal with little to no process latency.
- Demand Shaping Aligns with Supply. When they shape demand (emails to drive donors), it is done with a purpose based on the market shifts, current requirements, and blood traits.
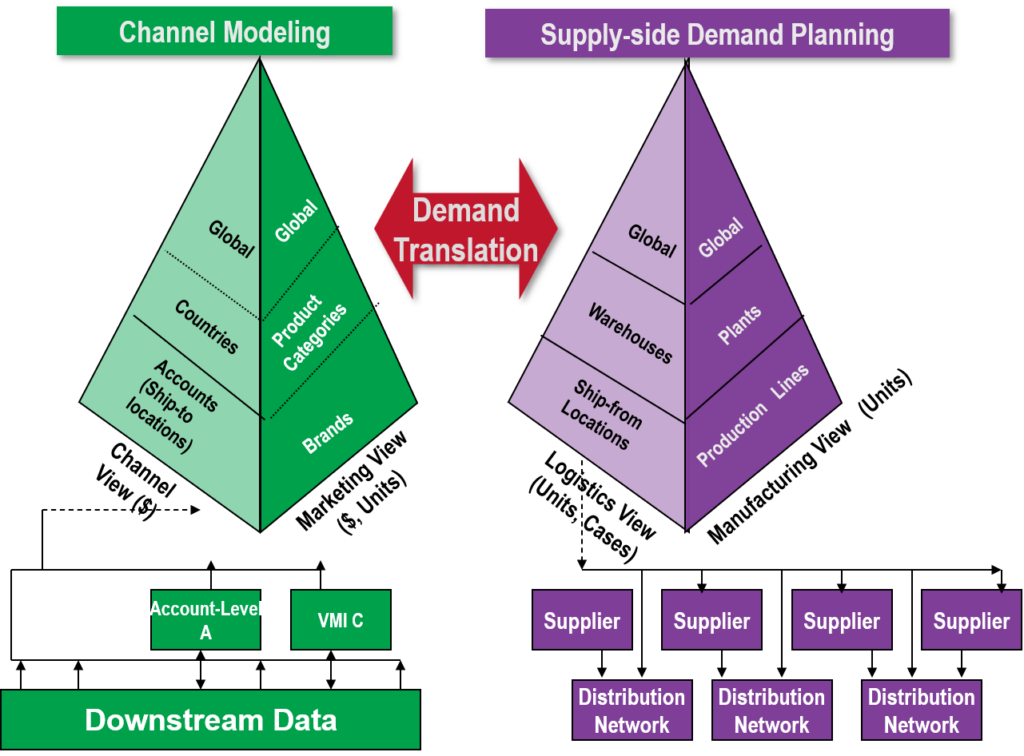
Most supply chain planning deployments cannot use channel data because the planning model is a “Ship from model” not a “Ship to engine.” The Ship-to model enables the management of the sell-through signal. In Figure 2, I share the difference:
Figure 2. Model Comparisons
Ship from model:
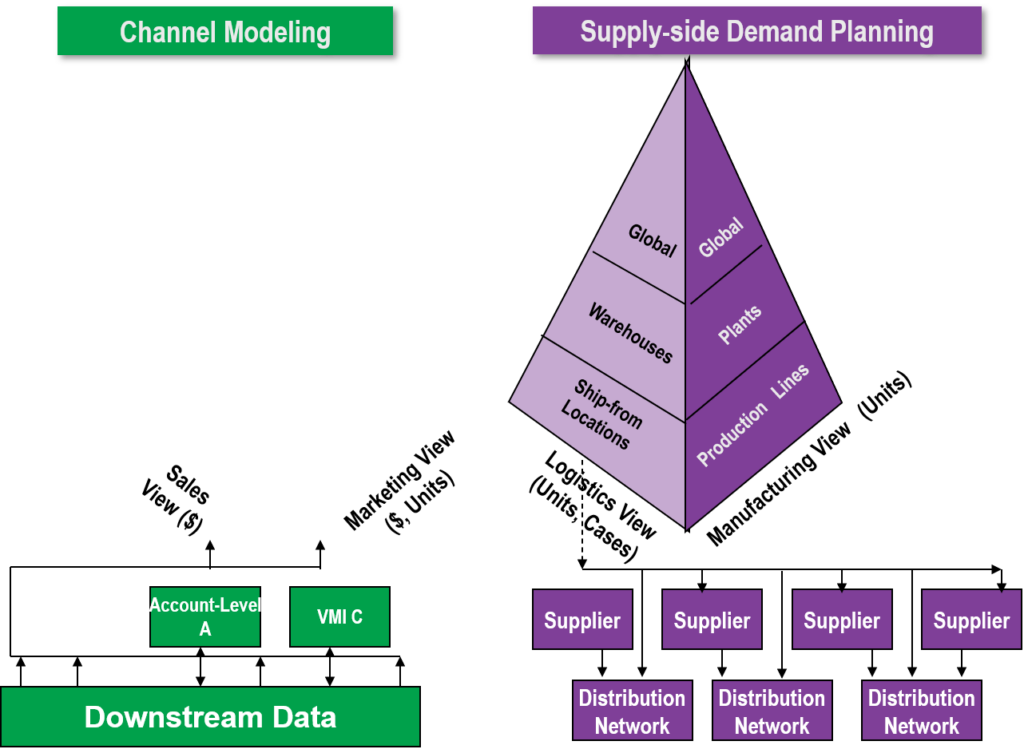
A ship-to model:
Another example of bi-directional orchestration is meat packing. There are 192 different ways to cut-up a cow. Based on market conditions, the meat packer will shift to optimize the demand opportunity. For example, is it more of a steak market? If not, let’s pack more hamburger.
As we have evolved with tight integration to Enterprise Resource Planning (ERP), companies have lost the ability to model demand streams and drive bi-directional orchestration. Most of the models are supply-centric with no place to put channel data.
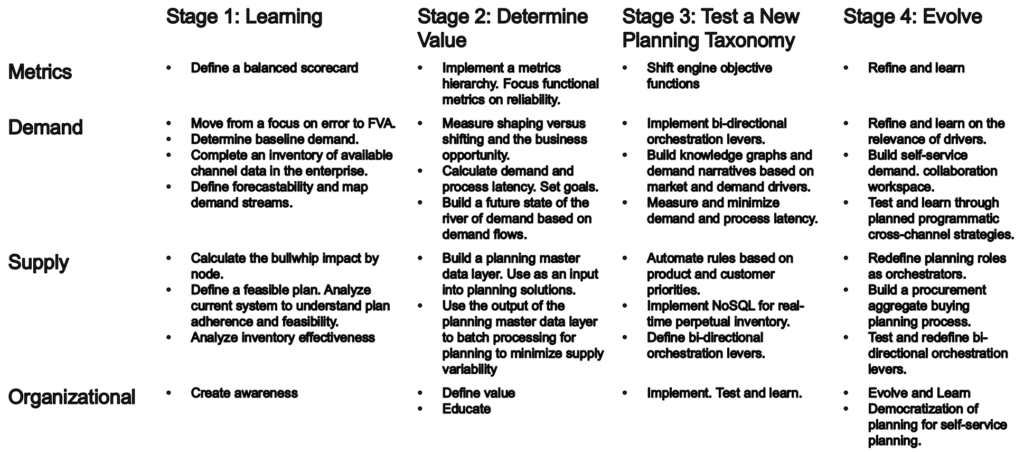
3. What defines maturity?
Maturity evolves over time. The first step is understanding the value of an outside-in model versus inside-out planning. Start by analyzing your Forecast Value Added (FVA) by demand stream. Shift the focus from demand error to FVA and calculate the bullwhip effect. Using network design technologies calculate the form and function of inventory. Analyze inventory health.
Table 1. Outside-in Maturity Model
How do we evolve current planning to outside-in?
Education is fundamental. Organizations need to be trained to use terms like demand latency, forecast value added (FVA), process latency, demand streams, and form & function of inventory. They need to recognize process and demand latency as waste.
The models also need slight tweaking. A key element is the redefinition of demand planning from a “Ship-from” model where location is defined as the shipment origin to a “Ship-to” model to be able to use channel data in the forecast analysis along with the modeling of form & function of inventory.
As the organization matures, the goals shift from a focus on functional optimization to drive balanced scorecard results. In the Supply Chains to Admire analysis, the balanced scorecard is defined as a growth, operating margin, inventory turns, and Return on Invested Capital (ROIC). When implemented in an organization, we add customer service (orders shipped complete and in full).
Is DDMRP an inside-out or an outside-in process?
No, it is inside-out. Demand-driven materials requirements planning (DDMRP) is built on an order signal which by definition is inside-out. The technique applies better math to determine material buffers which is helpful but carries the demand latency of the order.
How do companies get started?
Shift the focus from engines to rebuilding the models/taxonomies. As you analyze the current results on FVA, inventory effectiveness, and bullwhip effect, dollarize the impact.
Then take an inventory of all the sources of channel data in the organization. Analyze the business results for the past year and look for the opportunities that channel data could have improved the insights. Define the planning model to be outside-in (channel modeling) Decrease demand and process latency and the bullwhip effect.
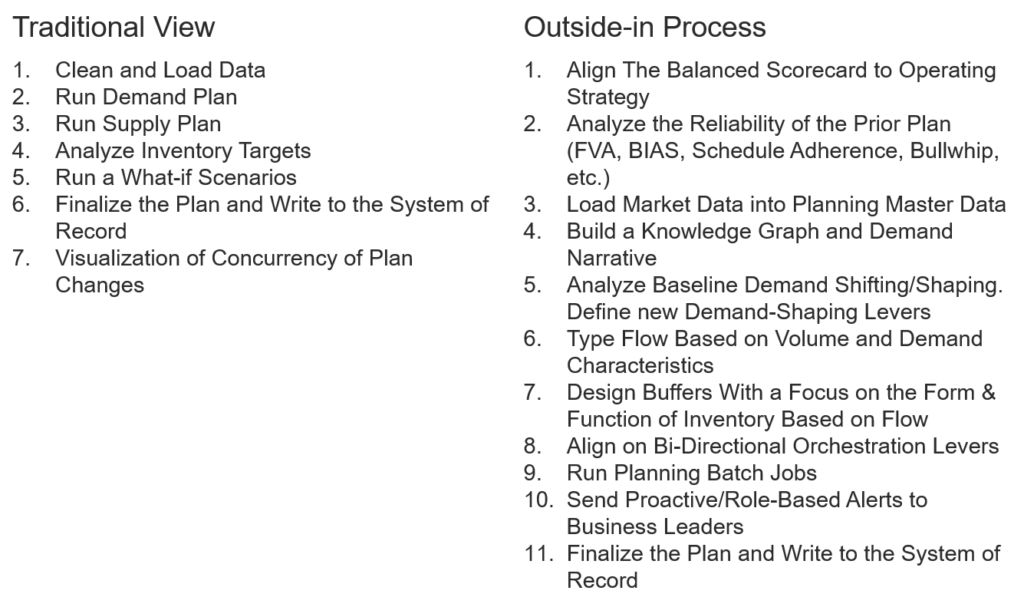
What does an outside-in batch job look like?
The batch processing of an outside-in process is quite different as shown in Table 3. Key elements include the analysis of the prior plan, the building and use of a supply chain master data layer, testing and building the knowledge graph based on market data, determining the baseline of demand, use of network design to set inventory strategies and align buffers, and the implementation of bi-directional orchestration levers.
Table 1. Comparison of batch processing of inside-out and outside-in processing
I hope that this helps. I will keep you posted on the class as we go along.