Lora's Latest Post

No Trash Talk Allowed

Definition of Asset

 A resource with economic value that an individual, corporation or country owns or controls with the expectation that it will provide future benefit.

Definition of Trash

Worthless or discarded material or objects, refuse or rubbish.

In the last year of my Wharton MBA program, the professor wrote on the board that “finance is the art of money passing hands until nothing is left.” I have found this to be a sad reality. In contrast, economic value is derived  from making or growing things to be sold.

In the process of making things, companies have to account for assets. While all leaders can agree that they want more assets and less trash, there is confusion about the best metric.

There are a number of ways that companies can account for assets and align them for value.  Recently, we have been studying the trends on three different measures of asset effectiveness. These three simple definitions have very different implications with far-reaching impacts. It is the goal of this blog post to explain the differences and help link you to the most impactful measurement to drive shareholder value.

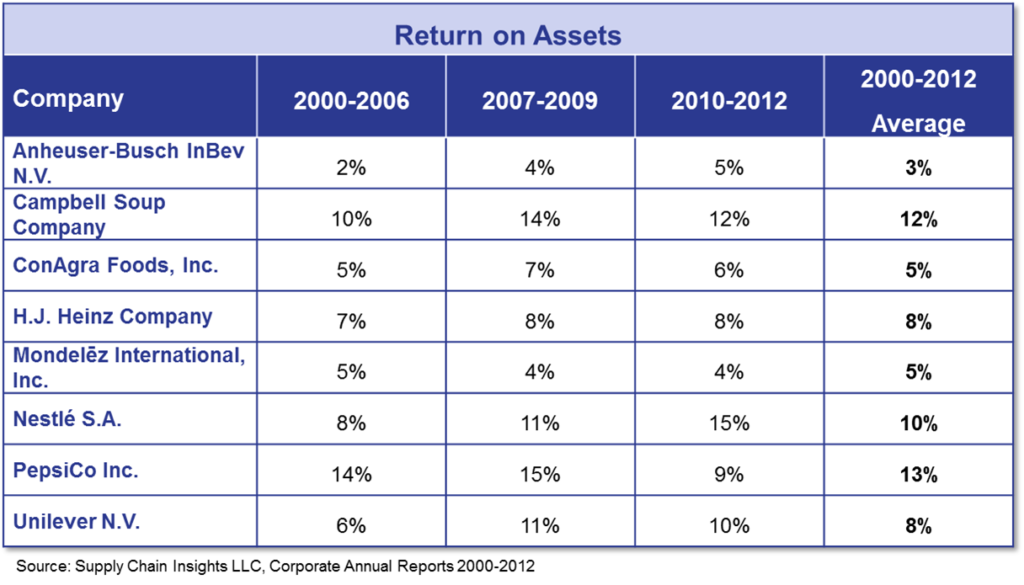
  • ROA: The return on assets is equal to net income/total assets. It can vary substantially across industries and should only be used to compare a company within an industry peer group. The assets are based on both debt and equity.
  • RONA: If you ask my friends at DuPont for the best asset measure, they will advocate Return on Net Assets (RONA). It is different from ROA in that it is equal to Net Income/(Fixed Assets + Net Working Capital). Fixed assets are tangible property and working capital is a measurement of current assets minus current liabilities. It is a longer-term perspective than ROA.
  • ROIC: Colgate and other consumer products companies swear by the Return on Invested Capital (ROIC) metric. It is a good measure of the company’s ability to generate a profitable outcome from investments. ROIC should be greater than the market value of capital. It is equal to net income-dividends/total capital. It can also be calculated as (net operating profit after taxation)/(invested capital).
When we correlate these three metrics to market capitalization, ROIC correlates in 85% of the industries, and RONA and ROA in 25% of industries.  Most supply chain leaders measure themselves by ROA. The more work that I do on metrics, the more I become a fan of ROIC.
To prove the point, let’s look closely at the numbers for the food industry. Note how different the numbers are. ROIC is not only a measurement of assets, but also the use of capital. Sadly, several of these companies don’t look bad when you look at ROA, but when you look at ROIC, it is clear that they are operating at a level below the market cost of capital.
For me this is not trash talk. Instead, it is about supply chain leaders delivering value.  If the cost of capital is 18% (a good average), then the top performance would go to Campbells, and many companies should be having the discussion of why they are under performing to market.
And, of course, the supply chain is a complex system with increasing complexity. Asset metrics should not be viewed in isolation to declare a supply chain winner. There are metric dependencies, but I like the inclusion of ROIC in the basket portfolio of metrics. What do you think? What do you think is the best measurement?

Search the Archives
Search
Share this Post
Email
Twitter
LinkedIn
Facebook
Pinterest
WhatsApp
Featured Image
Recent Posts

Is your Supply Chain AI Ready?

A simple quiz to assess an organization’s AI readiness.

The pace of change is fast and furious. Every day, technology advances faster than we can digest. A great challenge to have.

Determining whether a supply chain is “AI-ready” is less about technology and more about the gray matter between the ears of supply chain leaders. Leadership, alignment, and clarity of goals matter.

Too few companies are clear on the definition of supply chain excellence. Measuring and rewarding functional metrics reduces the firm’s value. Putting agentics on top of today’s processes can make bad practices run faster, reducing value.

The toughest job for the supply chain leader is challenging existing supply chain paradigms that were defined by the limitations of decades of supply chain technologies. As the curtain lifts on the potential of new forms of technology, process redefinition is our opportunity, but only if we are clear on what drives value. (Here, I link to the Supply Chains to Admire reports to help you define value. The next report will be published on June 23rd, along with my Dynamic Benchmarking Product, to help you define value in the face of your AI readiness. More information about the launch is at the bottom of this blog.)

Read More »

Case Study: A Scrappy Demand Management Approach

This study of Franklin Sports shines a light on the work that needs to be done at the sales account level to challenge a retail forecast, and also highlights the importance of a new technique for a forecast engine — reinforcement learning.

Artificial intelligence comes in many forms — large language models, generative AI, machine learning, unstructured text mining, deep learning, neural networks, reinforcement learning, agents, and agentics. While the industry is wigging out about agentics, I think reinforcement learning is a great step forward in the journey of Artificial Intelligence.

Read More »

Can We Side-Step the AI Spin Cycle?

When it comes to combining tech, 1+1+1 should equal more than 1. The impact should be exponential. Unfortunately, today, the answer is 0.

What do I mean? Let me explain.

I find that the supply chain technology market moves slowly along traditional technology lines. Conferences are usually focused on the use of technology, not on redefining work. This bothers me. I want it to bother you as well.

Here I share some insights to drive change.

Read More »

Supply Chain Health Check: The Power of an Orbit Chart

An orbit chart is a powerful tool for understanding the “health” of a supply chain and its potential for improvement. The supply chain is a complex, non-linear system with limited trade-offs. The relationship between trade-offs varies by industry, region, and size. The orbit chart is a diagnostic we use in the Supply Chains to Admire work. Here I explain the use case.

Read More »

Are You Writing a Check You Cannot Cash?

Don’t let a well-intending, but ill-informed consultant or technologist set an expectation that you cannot meet. No when wins when there is a check written that cannot be cashed. In this case, the consultant will move to the next account leaving you holding the bag. Fight back with a data-driven argument. Help the organization think about inventory more holistically.

Read More »