My LinkedIn news feed is full of congratulatory notes for companies listed on the Gartner Top 25 released yesterday. Tech companies celebrate their companies on the list, consultants give themselves pats on the back, and the companies making the list congratulate their employees.
My issue is that the Gartner methodology celebrates underperformers. The lack of clarity and discipline in the methodology gives the industry a false signal to define supply chain excellence. The Hippocratic oath in medicine is “do not harm.” My issue is that this rating scheme is used to drive software decisions, hiring practices, and process evolution. Two of the manufacturing companies on the list even sell and license their methodology to sell to others. Ranking on the Gartner Top 25 guarantees a revenue stream.
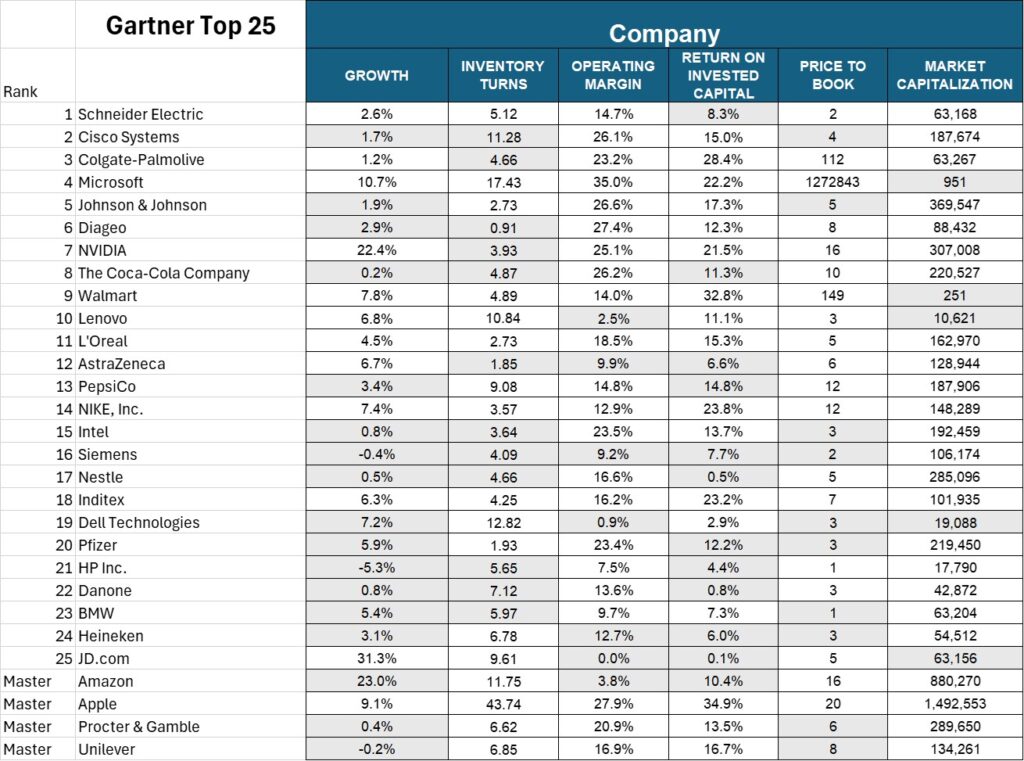
When we compare the companies listed on the Gartner Top 25 to peer group results for the period of 2013-2023, we find that 59% of the listed companies score below their peer group on year-over-year growth, 41% below their peer group on inventory turns, and 41% fall below their peer group on Return on Invested Capital (ROIC).
This is the twentieth year of the Gartner Top 25. I was an analyst in the room when it was designed and launched. The origin of the Gartner Top 25 was an effort by AMR Research to be seen as more strategic and more competitive in the market to their competitor Gartner. (Funny, right?) My push back now was my concern then. I just feel it more strongly.
The first issue is that the Gartner Top 25 is not a peer group comparison. The second issue is that the Gartner comparison is based on a short time frame (a three-year comparison). (We find that it takes at least five years to see the year-over-year patterns of top performers.) The third issue is that the methodology rewards large brand companies that frequently speak at events. (The Gartner list is a combination of the Fortune Global 500 and the Forbes Global 2000 greater than $15B in revenue.) The fourth issue is that 50% of the comparison is based on opinion. As a result, the top performers of CCL Industries, Clorox, Crocs, Cummins, L Brands, Lululemon, Monster Beverage, Paccar, Toro, and Taiwan Semiconductor never make the list.
While these companies outperform their peer group for improvement, performance, and value, their accomplishments are not studied. Some are too small, many are not visible at industry events, or well-known by the Gartner review group. However, I think that we need to understand why small companies are outperforming large, and better-known companies. And why discrete companies exhibit more resilient patterns at the intersection of operating margin and inventory turns? The insights would be helpful to the industry.
In Figure 1, we share the results on growth, inventory turns, operating margin, ROIC, Price to Book, and Market Capitalization for the companies making the Gartner Top 25. The cells in gray represent under-performance to peer group.
Figure 1. Gartner Top 25 2024 Winners Comparison to Peer Group for 2013-2024
Using the Supply Chains to Admire Methodology, we agree with Gartner on the results of Apple, Inditex, L’Oreal, and Nike. (Four out of the twenty-nine companies.) However, I would disagree with the conclusions in the press release. The lesson that I learned from my interviews with these companies is the need to focus work processes to manage product portfolios and drive innovation in new product launch based on market drivers.
My interviews do not support the premise that these companies are investing in AI and anti-fragile supply chains. Instead, I find that the companies with the greatest performance against peer group constantly innovate their products and services based on shifts in markets. The organization is aligned on customer delight, the team operates based on a clear strategy, they establish clear governance and definitions of supply chain excellence, corporate politics is low, and they are managed by a charismatic and omnipresent leader.
Conclusion
Make your own decision. I believe that supply chain superiority should be measured against peer group comparisons for a period of time that is long enough to see the patterns. I cannot see the patterns in a three-year comparison, and I find that it takes four-to-five years to see the results of a true supply chain transformation. I believe true excellence is sustained performance against peer group.
The Gartner methodology puts all companies greater than $15B in spreadsheet and shakes them up based on three-year averages and opinion.
Does it matter? Yes and No. I worry that academics and technologists have a false sense of which companies are driving true supply chain excellence. This false belief hampers the industry to drive for answers to understand what drives sustained performance. I see it as an opportunity cost to driving true innovation.
For the winning business leader, I say take joy in winning the beauty contest. For most, it will be the only time in your life you will take home the winning crown based on ratings by peers. However, when you go to sleep, please be sure that you remember that it is just that, a beauty contest. Supply chain leaders have more to do than pop a cork for a crown. True winners outperform peer group companies year-over-year driving shareholder value.
Your thoughts? I look forward to hearing from you.