 This afternoon, I poured myself a cup of tea to sit down and begin to pen congratulation emails to the Supply Chains to Admire award winners. This is the fun part of my job.
It is now our fifth year of analyzing balance sheets to understand which companies are outperforming their peer groups on the metrics of growth, operating margin, inventory turns and Return on Invested Capital (ROIC) while driving improvement. This work is not easy. It takes us three months and two full-time research assistants to finish the analysis. In calculating the winners, we measure improvement through a vector analysis of orbit charts at the intersection of inventory turns/operating margins and growth/ROIC. Each year, based on feedback from supply chain leaders, we refine the methodology.
This year, the analysis was for the period of 2010-2017 (post-recession years) and encompasses 655 companies in 28 industry sectors. We group companies by industry sector because the industries are so different in performance. Here I answer the questions I commonly get when speaking on the Supply Chains to Admire Methodology at conferences, to help the reader understand the results, and what it means for Supply Chain Excellence.
Who Won? What Can We Learn?
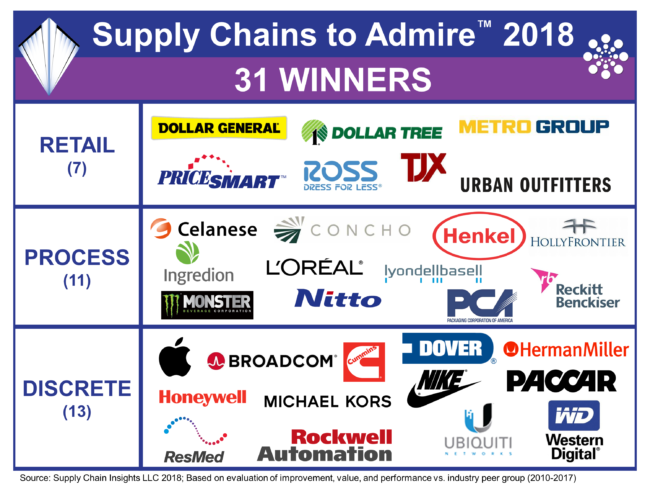
Drum roll. In Table 1, we list the winners. There are 31 winners: seven in retail, 11 in process industries and 13 in discrete industries. Each year as I work with the team to compile the data, and sort through the winners, the growing strength in retail surprises me (despite the Amazon effect), as does the slow decline in performance in manufacturing. Before the recession, manufacturing performance on the balanced scorecard of growth, inventory turns, operating margin and ROIC was stronger than retail. Today, it is not. Due to increased competition, retailers are taking supply chain management more seriously. The winners in retail redefined their models to focus on specific demographics. In the face of intense competition, they brought “new” to the market.
Table 1. Supply Chains to Admire Award Winners
Are There Repeat Award Winners?
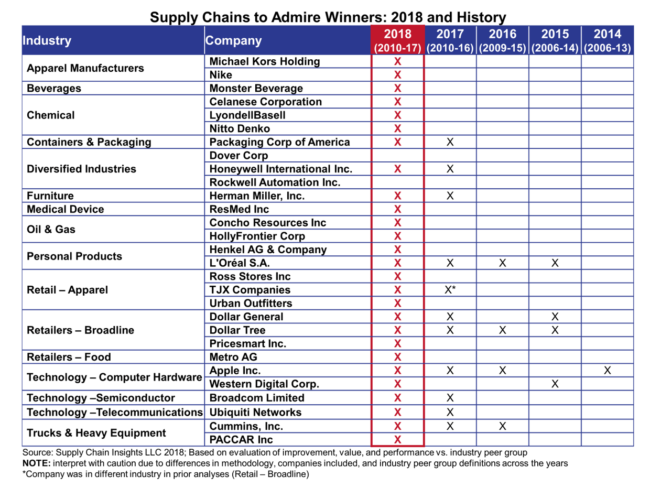
Yes. Twelve of the 31 winners return to the Supply Chain to Admire Award circle. This includes Apple, Broadcom, Cummins, Dollar General, Dollar Tree, Herman Miller, Honeywell, L’Oreal, PCA (Packaging Corporation of America), TJX, Ubiquiti Networks, and Western Digital. For greater insights, see Table 2. (Please note that the methodology changed slightly across the periods.)
Table 2. Repeat Award Winners in the Supply Chains to Admire Methodology
How Does The Supply Chains to Admire Methodology Compare to the Gartner Top 25?
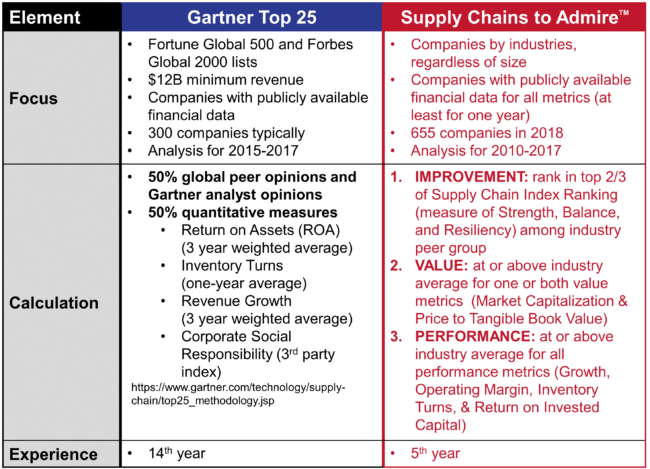
In Table 3, I share a comparison of the two methodologies. We actually started the Supply Chains to Admire methodology to give the market a data-driven alternative. Supply chain leaders wanted a comparison by peer group (the Gartner Top 25 groups all companies together), and companies with lower than $12 billion in annual revenue wanted a methodology to gauge success. In addition, since opinion drives 50% of the Gartner Top 25, leaders were seeking a more data-driven alternative. (I know that when I voted as an analyst in the Gartner Top 25 analysis, I never felt adequate to judge, and I easily tired of all of the public relations firms trying to convince me to move their company up in the rankings. The ploys—lunches, drinks, and presents—became humourous after a while.)
Table 3. Comparison of the Gartner Top 25 and the Supply Chains to Admire Methodology
Why Are Companies Like P&G, Schneider Electric, Toyota and Walmart not Listed on the Supply Chains to Admire? Are They Not Great Supply Chain Leaders?
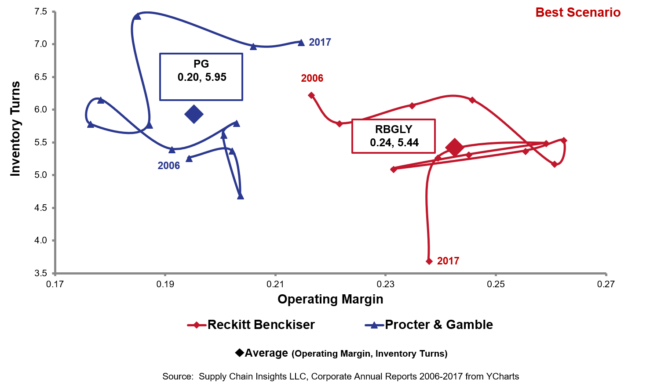
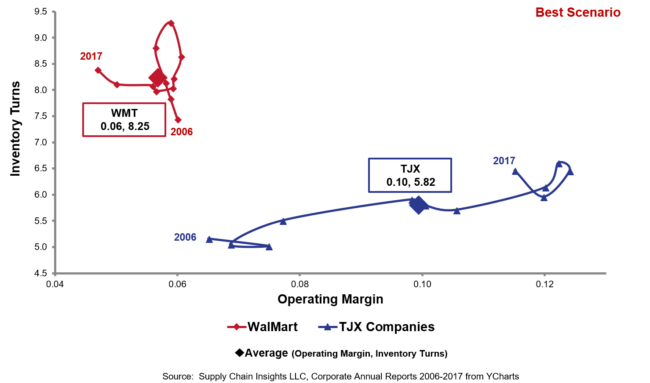
Yes, each company is a significant contributor to the improvement of supply chain practices; but the short answer is that each of these companies underperformed their peer group on the metrics selected. While Schneider has made great improvement in the past three years, they underperformed their peer group. While P&G was a top performer in the 1990s this is not the case now. Walmart is stuck. Here are orbit chart comparisons to help the reader compare these companies against their peer group winners.
Figure 1. Honeywell and Schneider-Electric Orbit Charts for Operating Margin and Inventory Turns for the Period of 2006-2017

Figure 2. P&G and Reckitt Orbit Charts for Operating Margin and Inventory Turns for the Period of 2006-2017
Walmart and TJX Orbit Chart for Operating Margin and Inventory Turns for the Period of 2006-2017
Is This a Good Evaluation of Supply Chain Excellence?
In answering this question, I must admit, I have mixed feelings. Customer success, ethics, policy, innovation, corporate social responsibility, and supplier development programs are all important factors in driving supply chain excellence but are not measured through this methodology. Why? There is just no way to get access to sufficient data to do the evaluation. However, through this work, we have accomplished connecting supply chain practices to balance sheet performance (this is something that I never understood when I was a Gartner analyst). My next step is to begin to triangulate the six years of quantitative data to this financial data. I want to understand how choices companies made drove balance sheet improvement. There is FAR and AWAY too much hype on this topic being spun by consultants and technologists.
I also find that most companies do not hold themselves accountable enough for balance sheet performance. The orbit charts, once you get used to them, are an effective way to measure trends. So the methodology, while not perfect, is helpful to understand which practices translate to value. For more on this, please attend the Supply Chain Insights Global Summit on September 4-7, 2018 in Philadelphia. We have 40 seats left and hope to see you there! It is a conference to have you think differently and drive new outcomes. With 95% of company performance stuck at the intersection of these important metrics, we think that it is time to make a dramatic change. Designed for extreme networking, the conference is to challenge existing processes, define winning strategies in digital transformation, and learn about new technologies. We hope to see you there!

Lead Time: A Broken Gossamer
If you are struggling with supply chain planning, dancing in the light of shiny objects, and scratching your head, please read on. My goal is to help you.
Please do not AI Stupid. What do I mean? AI Stupid is putting agents and agentics on top of existing architectures believing that making them faster and hands free add value. To me, this is fools play.
I love AI. I am excited about new technologies. To this end, I want to shine a light on how new technologies can help address the black holes and inconsistencies in today’s supply chain, which largely stem from the limitations of the first generation of supply chain planning and execution technologies. In this blog, I give you three places to start.