This week, Gartner is hosting their annual supply chain conference. A major item on the agenda is the announcement of what used to be named the AMR Top 25. It is now the Gartner Supply Chain Top 25. While the name has changed, the methodology has remained fairly constant, with a only a few changes, since 2004.
The research tries to establish “who did supply chain best” by looking at a weighted formula of Year-over-Year Growth, Return on Assets (ROA), and Inventory Turns for the Fortune 500 companies. The formula is a weighted average of three years of financial data for year-over-year growth and return on assets. (The first year is weighted at 50% and the subsequent years at 25%.) Inventory Turns values are based on an average of quarterly reporting for the past year. These values are then rolled up into a score where all of the companies of the Fortune 500 are stack-ranked across industries. This data is then shared with Gartner’s industry analysts, and the analysts vote on which companies they think exemplify supply chain excellence. The industry analysts’ vote represents 25% of the score. The data is also shared with industry peers and the peer group vote represents 25% of the score.
The AMR Top 25 was the first methodology that tried to connect financial metrics with supply chain excellence. The intent was good. It elevated the discussion on supply chain excellence and drove more discipline and rigor in the use of financial metrics. But, the methodology has some basic problems. I cannot get past these hiccups:
- Each industry is different. I feel company progress needs to be assessed within a company’s individual peer group. The methodology is biased to reward companies with few assets. As a result, asset-intensive companies like chemical or semiconductor will never win this beauty pageant. As a result, the crowned leader will always be a consumer electronics company or an e-commerce player. I strongly feel that putting all the companies in a spreadsheet, and treating them equally using the same formula, is not helpful to anyone. For example, take the information on the improvement in revenue per employee in figure 1. See how different the progress is on this metric by industry?

Each industry sector has a different potential and a different set of drivers. Some industries have made progress against this goal, others have made very little.
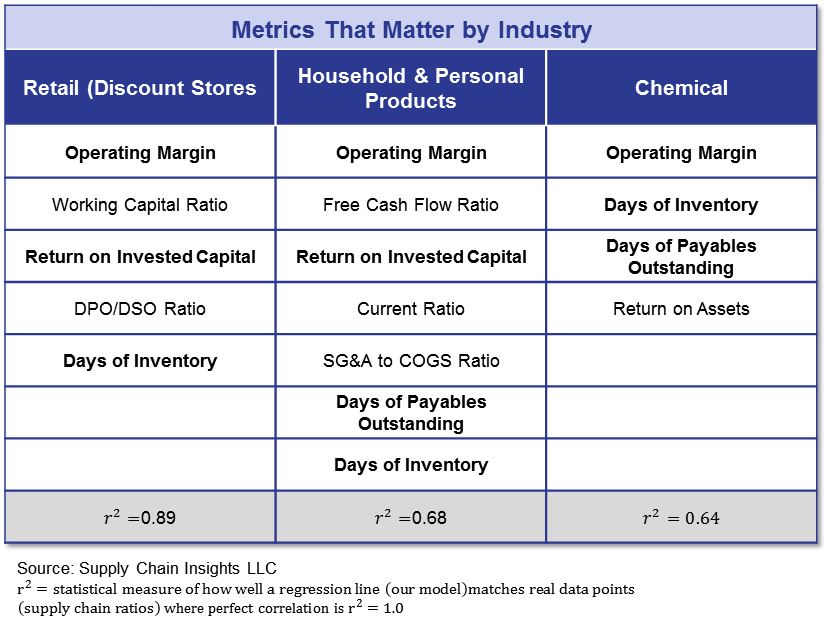
- The approach is too simplistic. Over the course of the last year, I have been working with Abby Mayer (@indexgirl), a Research Associate on our Supply Chain Insights team, to correlate 21 financial ratios to market capitalization data. We have taken six years of quarterly market capitalization data and evaluated companies within Morningstar sectors. We are analyzing 36 sectors and have completed 30%. (It is our goal to release the results for all sectors on September 11-12, 2013 at our annual Supply Chain Insights Global Summit) In the course of doing these correlations, and formulating an equation to predict market valuations, we found that the industry sectors are very different and that the correlations to market capitalization are low using only these three ratios. For example, compare the financial ratios that matter in the consumer value chain. The retail sector formula has far different metrics than the chemical industry.

- Over-dependency on ROA. So far in our analysis, ROA has only correlated in the chemical industry; for the rest, the better correlation has been ROIC (Return on Invested Capital). What is the difference? Return on Assets (ROA) is net income/total assets. ROIC is operating income/ total liabilities and shareholders’ equity. ROIC is a better measurement of the effectiveness of capital investments. In our determination of 10 out of the 36 Morningstar sectors, we find only three industries to have a correlation between market capitalization and ROA. That’s the chemical industry, medical devices and packaged food. We find that seven out of the ten Morningstar sectors also have a correlation to ROIC. Three of the ten have correlations to Return on Net Assets which is defined as net income/(property plant equipment + total current assets – total current liabilities).
- It should not be a Beauty Pageant. When I was an analyst at AMR Research, and a company would reel into one of our conference rooms to convince us how good they were at supply chain to improve their rating, it was hard for me to not take offense. I do believe that peer ratings matter, but I think that the impact on the financial balance sheet should represent at least 70% of the measurement.
- The methodology should be applicable to all companies. Supply chain leaders everywhere would like a methodology that is applicable to big companies and little companies and across currencies. It is for this reason that we have focused on building the Supply Chain Index.
- Inventory Turns is only part of the story. In our analysis, we find the correlation of market capitalization to inventory to occur in seven industry sectors; but, we also find correlations to Days of Payables in seven out of ten Morningstar sectors and Working Capital Ratio correlations in sixt of the ten Morningstar sectors. (Working Capital Ratio is (total current assets – total current liabilities)/revenue)
- Capital Markets reward balance in a Portfolio of Metrics. If the goal is improving market capitalization, three financial ratios are too simplistic. Capital market and financial market capitalization rewards a portfolio of metrics that are balanced. For more on this, see the PowerPoint slide deck on SlideShare that we will be reviewing this Thursday afternoon in our Supply Chain Index Part II – How and Why? webinar.
- Industry progress. I am surprised that when companies are compared within a sector for a period of five to ten years, that there is marginal to no improvement in the financial ratios, that can be improved by the supply chain organization to improve market capitalization. I find clear industry leaders in consumer packaged goods, food & beverage, consumer electronics, the semiconductor industry and mass retail. However, in many industries like chemical, branded pharmaceutical, apparel, medical device, and grocery retail, I find many companies to be stalled or going backwards. I think that we need to better understand why some industry sectors are able to power growth while balancing costs, cycles and complexity. We do not have these answers yet.
- Risk and Altman Z-score. Different industries carry a different measurement of risk. In our analysis, we find that five of the Morningstar sectors have a correlation to the Altman Z-score factor (packaged food, medical device companies, major pharmaceutical companies, generic pharmaceutical companies and medical instruments/supplies). This composite factor has the strongest correlation for major branded pharmaceutical companies. The Altman Z-score factor is an output of a credit strength test that gauges a publicly traded manufacturing company’s likelihood of bankruptcy. Can a supply chain team have a direct effect on improving the Altman Z-score? Check out the equation below, I believe that the answer is “YES!”


At the end of the day, the market will decide. The readers of this blog know that I take the definition of supply chain excellence very seriously, and just want to be sure that there is an educated audience to make the decision. While I laud AMR for taking the first step, I do not think that they have taken the research far enough. Join us for our webinar today, and stay in touch with our work on analyzing financial ratios.
We are on a countdown for our Supply Chain Insights Global Summit in September. At that time we will launch all 36 equations for each Morningstar sector, including the analysis of industry sector performance, and let you decide.