The first reaction to an orbit chart of the Food Industry performance for the past ten years, as shown in Figure 1, should be OMG. Followed by, what happened?
Figure 1. Industry Potential: Food Industry Average Performance by Year from 2016 to 2025

The precipitous fall in supply chain performance was largely self-induced: industry veterans held on to what they believed were best practices from the “good old days,” like Linus clings to his blue blanket.
As the market shifted, the industry did not adapt. Employee turnover and leadership were major factors. Supply chain practices from the 1990s — reducing demand error, sweating manufacturing assets, and outsourcing new product launches — were mandated as best practices when the industry needed to adapt to changing customer preferences and increasing supply volatility.
A Look at Performance
For the period of 2016-2025, the industry average was 11% operating margin and 7.82 inventory turns, but note the 35% decline in industry inventory performance. Few companies were aware of or adapted to the shift in industry potential shown in Figure 1.
Today, the shifts are faster as consumers trade down to cheaper brands and retail private label gains market share. Major inflationary spikes in protein, especially beef and eggs, due to supply shortages and disease-related disruptions in 2025, continue the never-ending ride in commodity volatility.
The industry is not adapting. No company is using point-of-sale data well, and there is a lack of understanding of how to redefine processes with AI with market data to drive improvement. Instead, companies are layering new and promising technologies on top of historic processes, which will only degrade performance faster.
Figure 2. Food Industry Performance for 2016-2025
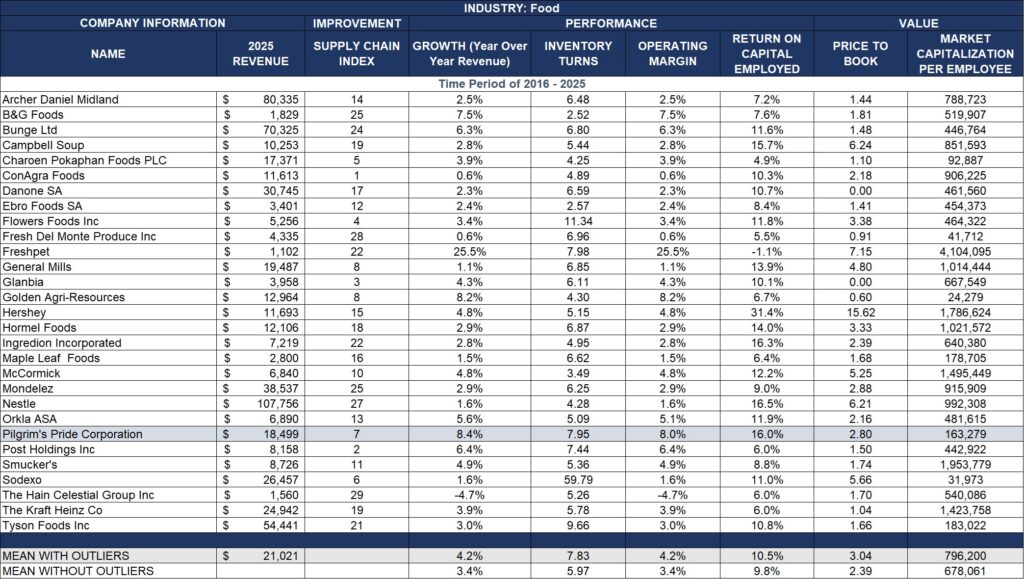
What Can We Learn?
Big Brands and Large Companies Underperformed. Take a look at the list. Pilgrim’s Pride is a manufacturer of chicken. The Company outperformed the industry giants of Campbell’s, General Mills, Hershey, Kraft/Heinz, McCormick, Mondelez, and Nestle. It is not because Pilgrim’s Pride is such a strong performer; in fact, the lack of understanding of historic supply chain practices may actually be a boon. The need to fix traditional supply chain processes in the food industry is greater in larger companies, but there is no momentum to act.
Industry Consolidators Believed that the Best Supply Chain Was the Efficient Supply Chain. Kraft/Heinz and Mondolez fell victim to industry consolidation, with financial ownership driving an efficiency or lower-cost agenda amid declining industry potential, and consumers’ focus on healthy eating and regionalization. Only about 15% of the volume could be managed efficiently, yet the consolidators drove a knife into the company’s heart by mandating cost-cutting measures. Most of the volume, due to a rise in complexity, required an agile supply chain response. The merger mania resulted in employee turnover and a loss of supply chain domain expertise.
Rise of Unchecked Complexity. Companies focused on a marketing-driven, not a market-driven, strategy. As a result, item complexity grew unchecked, the long tail of the supply chain expanded, making many products unforecastable, and intensifying the bullwhip effect. Freight market volatility and rising commodity prices increased costs and risk in a market where the company was focused inside-out rather than outside-in. Procurement constraints increased, but the signal to procurement was poor because traditional processes focus on reducing manufacturing constraints rather than on the bi-directional orchestration of manufacturing/procurement trade-offs.
Inside-out. Not Outside-in. As the long tail of the supply chain grew, with increasing complexity, order latency (the time from shelf take-away to order) increased by 15-20%, making the organization more insular in a volatile world. No company is actively measuring demand shaping versus shifting, or effectively using point-of-sale/channel data.
Focus on Functional Metrics. Manufacturing-centric organizations like Kellogg shifted demand — failed attempts at demand shaping — and pushed factories to their limits, focusing on OEE. As a result, costs increased, volumes sold were flat, and cash-to-cash took a nose dive. The end result? Kellogg was sold at a discount after several leadership changes.
Summary
I remember when the Campbell’s, General Mills, and Kraft teams were strong in driving supply chain innovation. Not so today. The fall of the food industry in delivering supply chain performance is sad, and another warning of why we should not be talking about the autonomous supply chain and the automation of practices that reduce shareholder value.
Let me end with a footnote. When I visit a private equity company, I see many new food products with premium ingredients targeted at regional markets. The candy on the counter from Unreal looks much like a Hershey’s Reese’s Cup, but tastes better, and the snacks, looking much like a Frito-Lay bag of tortilla chips and salsa, taste fresher. The food industry has, over the years, focused on cheaper ingredients rather than eliminating supply chain waste associated with traditional processes. I think it is time to adapt the supply chain to support a more agile product portfolio. Don’t you?