As a blogger, you can get feedback in real-time. Pretty cool. Right?
I answer every question I get and sometimes I share my answers. This is the case today.
Recently I had a comment on the Supply Chains to Admire post. The comment was, “While I appreciate comparing companies to their peers, I am lost on how Amazon and Walmart can be excluded (nevermind P&G). Amazon’s because of their breath in physical and digital supply chain, innovation in material handling, transportation, etc and their vision completely disrupting the industry. Walmart excluded who has also revolutionized Supply Chain and is now the largest company in the world (double the revenue of #2), and the 11th most profitable company in the world. Lora Cecere has deep insights into Supply Chain, I would love to see further analysis on why these companies did not make the grade.”
Let me start the answer with some background. Supply chain leaders want to deliver supply chain excellence. They are competitive, but there is no standard definition. Traditionally the focus has been on building efficient organizational silos for make, source, or deliver. However, we know from our research that efficient silos do not deliver the highest levels of balance sheet performance. The supply chain is a complex nonlinear system requiring a focus on a balanced portfolio. As a result, for most companies, the goals are unclear and the financial metrics are not well-understood.
However, if you ask supply chain leaders if they want to improve value, drive operational improvement, and outperform peers, the answer will be “Yes!”
In our research we are trying to figure this out. We know the research isn’t perfect, but it does identify some important patterns. It is a study of peer groups.
So, let’s take the first question, “Why not Amazon?” The simple answer is there is no other Amazon. They do not have a peer group for comparison. They are in a league of their own. We do not include them in the analysis because there is no peer group comparison. Clearly, Amazon is a supply chain leader. Now let’s continue the discussion on the next two companies.
About the Research
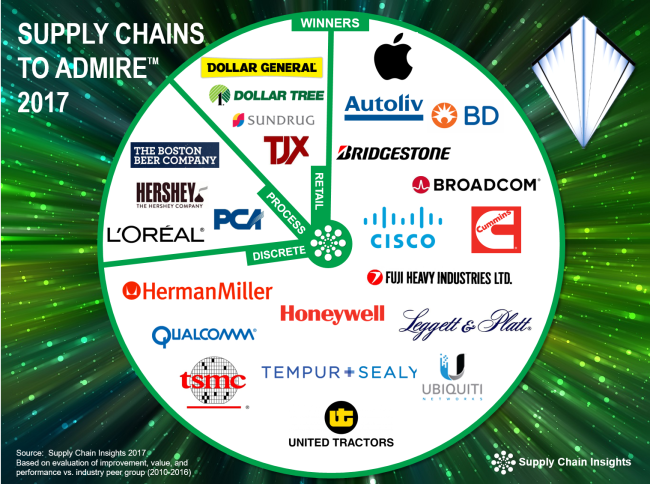
The Supply Chains to Admire analysis is now in its fourth year of development. In the 2017 analysis, we compared 495 companies in 31 industries. Based on the analysis there are 24 winners. These are shown in Figure 1.
We believe that the test of a true leader is the ability to not only drive higher levels of performance, but to sustain competitive advantage over time. Using the Supply Chains to Admire analysis, three companies—Apple, Cummins and TSMC—are winners for two consecutive years. Dollar Tree and L’Oréal are winners for the past three years. Intel was a winner in 2015 and 2016, but Cisco is the consistent top performer. Cisco has made the winners list for the past four years.
Figure 1. Winners of the Supply Chains to Admire Methodology
Some Background
This analysis is a lot of work (roughly three months of work for three employees.) It is a study of patterns. You might ask why we go to all of this trouble. The answer is because we are a research company. When we started the company, we needed an objective measure to gauge supply chain improvement and performance. The research gives us a clear objective function to compare the characteristics of companies making improvement, and those that are not, as well as a comparative peer group for companies that are outperforming their peer group.
When I started this research in 2010 I believed that P&G and Walmart would meet this criteria. Walmart made the list for two prior years, but recently has not. P&G, much to their chagrin, has never made the list.
The analysis surprises me. Let me explain. Before I started this analysis, I believed that P&G and Walmart were unquestionable supply chain leaders, and that they consistently outperformed. While I still believe that all three of the companies made great contributions to supply chain management over the course of the last two decades — Amazon blazed the trail for new business models, Walmart is the market leader for sharing channel data through Retail Link, and P&G was the early thought leader for Consumer-Driven Value Networks: P&G and Walmart no longer outperform, and Amazon is in a league of its own.
Figure 2. Overview of the Methodology

A Closer Look at P&G
The starting point of the analysis is an orbit chart. This year-over-year comparison enables the visualization of performance on two metrics. In Figure 3, the orbit chart is on inventory turns and operating margin (the average values for the period are shown in the boxes). Note that for the period of 2010-2016, P&G underperforms the industry peer group in both growth and ROIC. While the decline in growth can be explained by the significant divestitures, the company has chosen to underperform against ROIC when compared to their peer group. In addition, they rank last in their ability to drive metrics improvement.
There is much that P&G does well. I love their work on supply chain talent and I think that they were a strong supply chain leader until the acquisition of Gillette. This acquisition, along with others, as shown in Figure 3, pushed the supply chain out of balance. I think their outsourcing of IT makes it difficult to accelerate innovation.
Figure 3. Orbit Chart of P&G and Reckitt Benckiser
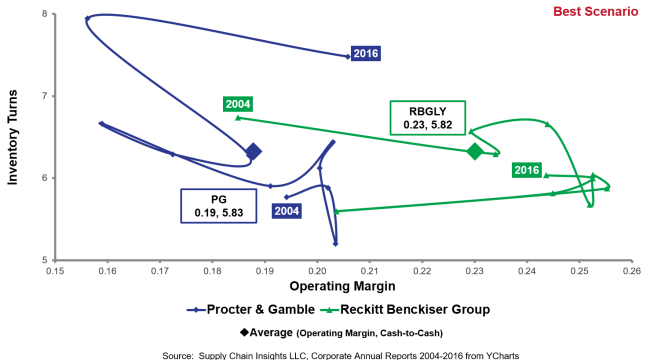
In addition, few companies are better on the stump at conferences. I love the open sharing of P&G. In this process they build mind share and thought leadership. You will actively see speakers touting progress excellence, even to the point that others see them as a bit cocky; but, you will seldom see the sharing of balance sheet performance against peer groups. The reason why? The balance sheet performance (impacted by supply chain decisions) is not as strong in the period of 2010-2016 as it was during 1980-2005. P&G lost ground against their peer group, as judged by this metrics portfolio, in the last decade.
A Closer Look at Wal-Mart Stores, Inc.
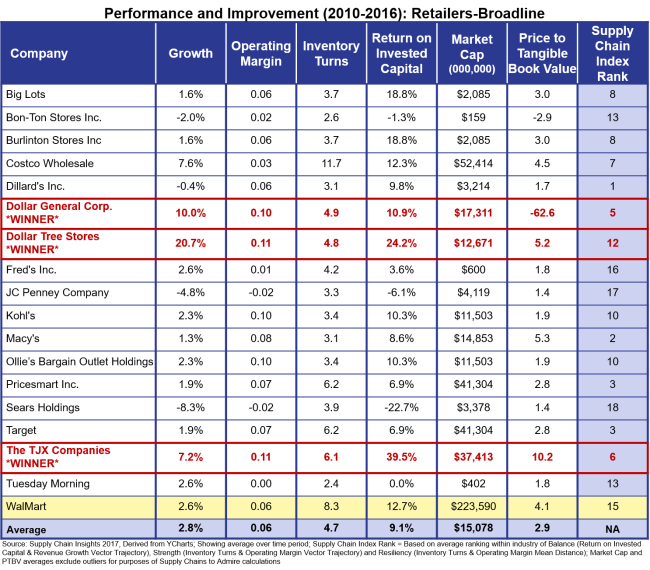
When we take a closer look at Walmart, we see stalled improvement on performance metrics. Note in Figure 4 that Walmart is last place in driving improvement. They are losing ground in growth to both dollar store format retailers and e-commerce retailers. Walmart was excluded from the list based upon a lower growth rate than the peer group, and the lower rate of improvement (i.e. progress at the intersection of the metrics of operating margin/inventory turns and growth/ROIC). Note that in this chart Target is driving more improvement while performing at a higher level in operating margin than Walmart. In contrast, Walmart is turning inventory faster but not making as much improvement.
Figure 4. Orbit Chart of Target and Walmart along with Performance Data for Broadline Retailers

What Can We Learn?
The answer to the question highlights the principles of the methodology:
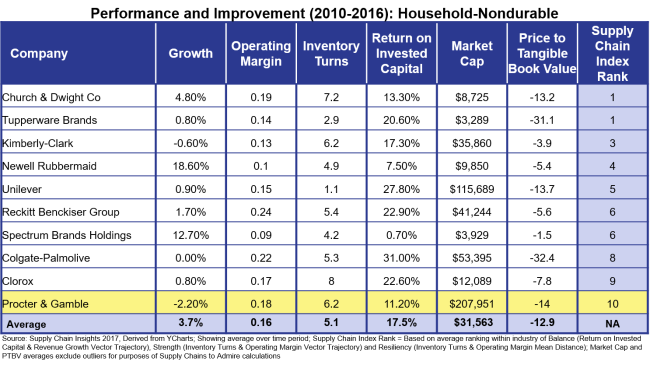
- Balanced Scorecard. It is hard for companies to sustain performance on a balanced scorecard against a peer group. Metric balance is difficult for supply chain teams. The design of a metrics scorecard should follow a supply chain strategy. For example, P&G’s low rate of ROIC may be a strategy choice, but in these times of shareholder activism, significant deviation on these metrics is getting harder and harder to defend.
- Driving Improvement. As companies drive performance, it gets tougher and tougher to drive improvement. Like a lean athlete, it gets harder and harder for top-performing companies to improve lean muscle mass. As a result, companies that drove significant competitive advantage a decade ago struggle to drive improvement in the last six years without a significant redesign.
- Pedaling Uphill Is Easier Than Downhill. Expansion is easier than consolidation. Companies with higher growth rates tend to do better at sustaining balanced scorecard behavior.
- Singular Metrics Strategies Do Not Drive Excellence. There is a higher correlation to Price To Tangible Book Value or Market Capitalization with a balanced portfolio than a singular metrics strategy.
- Peer Groups Provide a Measuring Stick. This is a complex subject and the peer group analysis provides a measuring stick. It is fool’s play to place companies in a spreadsheet and shake them up and declare a winner.
- Numbers Matter. There are many perceptions on supply chain winners. However, remember, we take numbers to the bank. Perceptions are not always reality.
In preparation for the 2017 Supply Chain Insights Global Summit on September 5-8, we continue to work on this data set. We are currently loading supply chain performance for 1,491 companies, using 520 balance sheet and income sheet metrics and ratios, along with market indexes and our quantitative data from the past five years to understand the trends and characteristics. We will present this openly at the conference, and hope that you can join us.
Thanks again for your questions. I hope that this helps. I would love to get your thoughts.