 When I engage with supply chain leaders , I ask, “Are you making progress?” Most will nod their heads ‘yes’, but upon a closer look at the data they admit they are stuck. Acknowledging this truth is a freeing moment. Why? It is hard work to maintain the status quo in metrics performance. Most leaders are treading water. When asked to do more, they try to deliver. They often fail. A downward-facing red arrow signals the lack of progress.
Before we continue, let me share a perspective. A balanced portfolio of metrics delivers the greatest value (market capitalization or price to tangible book value). The supply chain is a complex, nonlinear system. Globalization increases the challenge to deliver improvement. When supply chain leaders focus on unrealistic goals of inventory or costs, they will throw the system out of balance. This is often the case. In the setting of strategic goals, executive teams often set stretch goals not aligned with supply chain potential and run the risk of throwing the system out of balance.
We also see tension in the management of inventory. As demand and supply volatility increases, the design of inventory buffers increases in importance. Unfortunately companies make several mistakes. The first is a singular focus on safety stock, and lacks the holistic management of the form and function of inventory. As demand error increases, it is important to push inventory back into the supply chain to hold as raw materials common platforms, and define postponement strategies. Frequently we see companies trying to manage inventory as a bank account, dipping into safety stock to fund projects and improve cash-to-cash. This is detrimental to driving value.
Table 1. Definition of Form and Function of Inventory

These discussions are intense and often convoluted. We find a general lack of understanding of the impact of complexity on supply chain performance. While process industries focus on the efficient supply chain of mass production, marketing strategies focus on late-stage postponement strategies and customization. As a result, the front office and back office strategies are not aligned.
Fighting the Status Quo
There is a pervasive belief in the industry that supply chain leaders are making progress. After all, isn’t this why we call traditional processes ‘best practices’? Isn’t it about people, process, and technology and process evolution? We think not. Traditional processes are not equal to today’s challenges. Technology companies are pushing their products. Business development campaigns, advertisements, and consulting calls to implement ERP, upgrade analytics, and focus on best practices inundate traditional agendas. The stories of success are largely project-based improvements that did not translate to long-term balance sheet value. Or they were progress in vertical supply chain efficiency in manufacturing or transportation. It is seldom a story of the translation of supply chain transformation to improve dynamic organizational capabilities with sustained balance sheet results.
I encourage teams to look at the facts. This is the goal of this post. The belief of “best practices” as defined by historic supply chain processes is not supported by the balance sheet analysis. We are making the mistake of having companies tasked with a forced march to implement the “tightly integrated supply chain” which is inflexible and cannot sense market trends. While companies need ERP as a system of record for transactional processing, it is not the future of supply chain analytics or innovation.
The opportunity? Rethink supply chain practices. Companies do not make progress when we attack problems in the same old way. To illustrate the point, here we share snapshots from four different value chains: automotive, healthcare, consumer, and technology. In each case, note that the greatest improvement is happening in industries like contract manufacturing where innovation is a necessity due to low margins. It is not happening in industries with traditionally high margins like pharmaceuticals or household products.
Supply chains pedal better uphill than downhill. Companies balance supply chain metrics better in good times than bad. In a nutshell, we find that good news of successful growth travels quickly; conversely, bad news of declining growth moves slowly. There is denial. As a result, the supply chain cannot adapt. To gain this understanding, compare the results below automotive industry to the consumer value chain. The automotive supply chain is rebounding with growth post recession.
A Closer Look at Value Chains
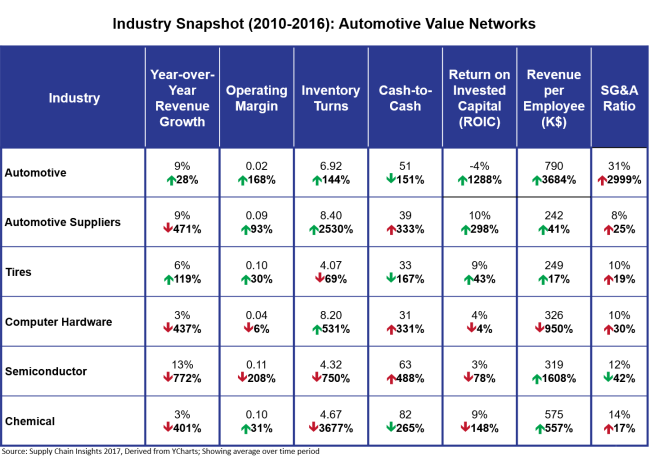
To understand these trends, let’s take a closer look at value chains. Of all the value chains, the automotive value chain is making the greatest improvement. As shown in Figure 1, car buying growth stimulated the value chain.
Reader’s note: the way to read this chart is to first identify the average value for the metric for the period of 2010-2016. Then identify if the peer group is making progress. For example, the average growth rate for the automotive industry for the period of 2010-2016 is 9%. The growth rate of 2016 when compared to 2010 is an increase of 28%. As you scan across the first line of Figure 1, you can see that the industry improved performance in all metrics with the exception of SG&A. A green arrow represents improvement while a red arrow indicates a deterioration in metrics performance. As you scan down the chart, note that the green arrows are fewer and fewer. In critical industries like semiconductor and computer hardware, growth is down, operating margin is off, and inventory turns are declining. This is the case in most industries.
The source of this information is a syndicated data source for financial data (YCharts). We take public companies and place them into industry peer groups and begin the analysis for time periods. The period of 2010-2016 represents post-recession results.
Figure 1. Automotive Value Networks
The consumer value chain has fewer green arrows. While the packaging industry has consolidated to gain economies of scale, progress in this value chain is an exception. The transformation of the channel with e-commerce is leading to disintermediation, and transformation of trading relationships. Historic leaders, with strong global teams, are insular to change and have been slow to develop new business models to use channel data.
Figure 2. Consumer Value Networks 2010-2016
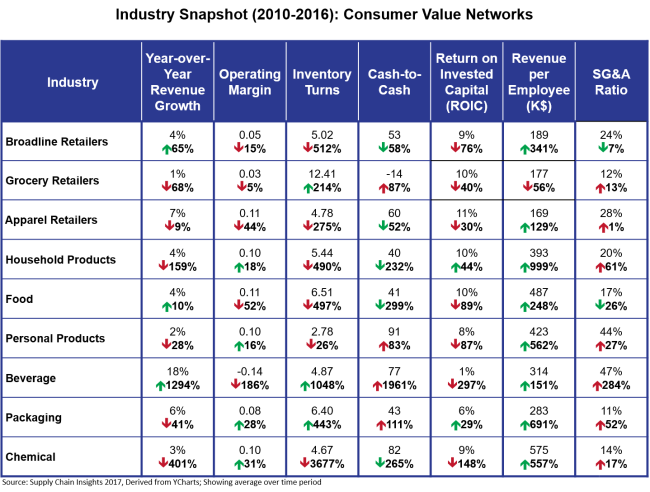
In most industries there is progress in cash-to-cash, but not in inventory. Elongation of Days of Payables improves the state of Cash-to-Cash for the enterprise, but not the value chain. Why? The focus on the elongation of Payables adds cost and waste to suppliers in the value chain. It is a short-term gain for the enterprise with long-term implications. Also despite improvements in revenue/employee, these improvements do not counteract market factors to offset the deterioration of margin. To overcome these trends, companies need to move to bidirectional orchestration across source, make and deliver. Most have focused on vertical silo improvements, but not the redesign of value networks. Efficient organizational silos do not deliver effective supply chain performance.
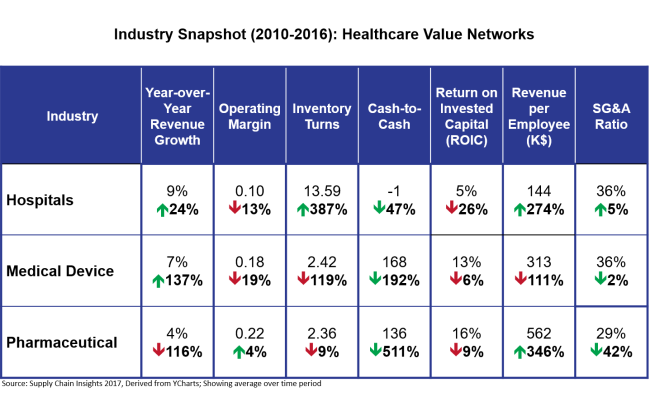
Figure 3. Healthcare Value Chain 2010-2016
The biggest and most detrimental shifts in market drivers occurred in the Technology Value Chain. Post-recession negative market winds blew strong in this value chain. It is a case of when the going gets tough, the tough get going. Ironically, despite these odds, in the Supply Chains to Admire Research there are more leaders from the Technology Value Network than any other value chain. While the process industries focused on safety stock, the high-tech sector used network optimization technologies to design the form and function of inventory and align push/pull decoupling points. This industry takes planning seriously. Excel ghettos dominate process industries, and the overuse of spreadsheets becomes a barrier. High-tech organizations are the best planners across all industries. Career paths, analytics, and centers of excellence are better defined with greater results in these industries.
Figure 4. Technology Value Chain Progress 2010-2016

Conclusion
What can we learn? Value chain views are a litmus test: a barometer of business process improvement. We think it is time to sit back and reflect on the trends.
For us, there are five takeaways:
1) Set realistic set points. Use these charts to understand what is possible in both the areas of performance and improvement within your industry and for value networks. Define your balanced portfolio and align to realistic goals
2) Focus on a balanced portfolio of metrics. The concept of a balanced scorecard is easier to say than do. Planning and horizontal processes help companies achieve balance. Get good at planning. Do not limit planning options to substandard options offered by ERP providers. IT standardization discussions derail many great projects. There is a false belief that when planning tools are purchased from the ERP vendor there is a higher probability of success. This is not the case. Use the data in these charts to define your balanced scorecard.
3) Learn from other industries. Start by getting honest on current supply chain performance. Hold yourself accountable to the balance sheet and income statement data within your industry, and branch out to understand how contract manufacturers have driven improvements between trading partners, or how high-tech leaders have driven differentiation in the face of tough market conditions.
4) The opportunity is beyond the four walls of the enterprise. Pushing water uphill is hard. Realize when you are stuck and challenge the status quo. The greatest opportunity is the automation of processes between the vertical silos of the enterprise and the definition of multi-process flows between companies in value chains. Go beyond the traditional concepts of tight integration and focus on the harmonization and synchronization of data across value networks. What to do? Invest in the use of cognitive computing engines and machine learning to clean data and automate/define adaptive rule sets. Test blockchain concepts to drive B2B process flows and use sensors/Internet of Things to automate real-time data flows. Focus on the confluence of technologies. Experiment with Open Source alternatives and design these flows outside-in. Avoid the traditional inside-out definitions. (If you want to align with other companies to test these technologies to automate B2B join the Network of Networks effort. Our next meeting is in Dallas on July 25-26.)
5) Avoid business process outsourcing. Many companies today are looking at BPO strategies as easy answers to reduce costs. We find that extreme use of BPO initially reduces costs, but reduces long-term competitiveness. Use caution. While the Indian outsourcing firms offer lower costs of labor, we find that most Indian outsourcing firms struggle to understand the process implications of organizational change management and process redefinition. Buyers beware.
For more on these trends, and technology innovation areas, join us at the Supply Chain Insights Global Summit on September 5-8, 2017. At this conference we will share the insights of correlations between our five years of quantitative studies (7000 responses), 15 years of financial data and market indexes. Join the conference to gain an understanding of the characteristics of companies that have driven the greatest improvements on cost, growth and value. The program focuses on supply chain innovation. We handpick the presenters. Our goal is to mine data using big data analytics to give us new insights and drive a quantum change in supply chain management processes. (For more on this project, check out this post.) We hope to see you there!


Let’s Form a Coalition to AI Smart
The supply chain is knotted. It is unruly. It is complex. It is growing more so. Current supply chain planning deployments often degrade value. This is