Vijay recently chastised me on my last post. He said, I have been writing lately about what not to do in rethinking supply chain planning, but less about what to do. This blog post is in response to a comment from Vijay Harrell on a recent post on supply chain planning. Here I answer his comment:
“One thing I’ve been thinking about as I read your work and the newsletter is that most leaders already agree the system is broken – but they don’t yet have a low-risk way to act differently.

What seems to be missing isn’t insight; it’s a small, repeatable experiment that helps teams see the mismatch you’re describing.
For example:
– What happens if, for one cycle, a team replaces forecast accuracy with a single outcome metric (customer fulfillment inside lead time, revenue at risk, order stability)?
– Or if they label every planning input with “freshness” before trusting the math?
My hunch is that once people experience the gap between optimized plans and executable outcomes – even in a narrow slice – the unlearning starts naturally.
Curious how you think about converting all this research into a few “safe-to-try” experiments that leaders can run without a major transformation mandate.“
Safe-to-Try Experiments
I think that this is a great callout. The market is a bit of a mess with a lot of hype. AI is everywhere, but nowhere, and supply chain planning technology providers are being opportunistic. Most are touting AI STUPID techniques. Never layer Agents on existing platforms. There is no one RIGHT solution. Your goal is to sort through many flawed solutions.
Until the market sorts itself out, here are my recommendations.
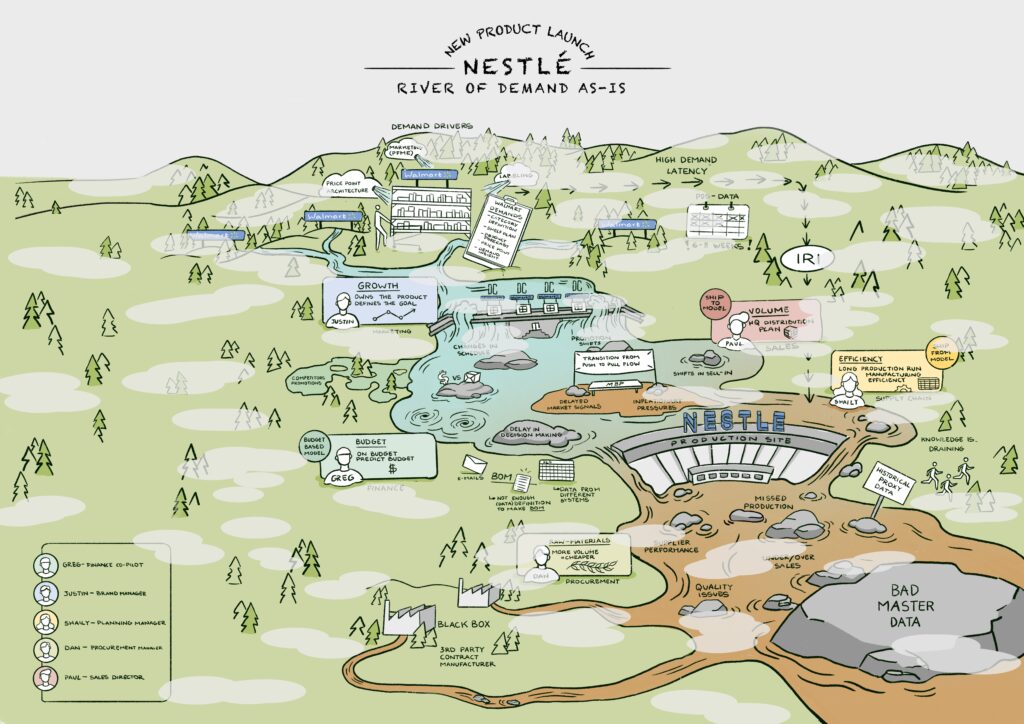
Start by defining your supply chain using the River of Demand Methodology. When insights are unclear, color the water brown; when insights from data are clear, color the water blue. For reference, here I share a River of Demand generated through the OMP Project on outside-in planning, in collaboration with Nestle, for a New Product Launch. List your rocks (barriers), data sources, and roles. As you do this, identify what each role would benefit from seeing.
Then focus on which roles and processes to automate using new forms of technology. List these and, using design thinking, map what each role needs for insights.
After mapping these flows and roles, consider these quick-win projects.
- Build Customer Listening Posts. Spend the time as the market sorts itself out to get good at analyzing customer sentiment. Use unstructured text mining and Large Language Models (LLMs) to gain insight into true customer sentiment. Analyze return data, damage, on-time performance, customer one-off requests/exceptions, inventory levels, and order patterns. (For consumer-facing companies, include rating and review data, shelf imaging to understand planogram compliance, price, and broker data.) Build a cost-to-serve model and use the insights in top-to-top customer meetings and monthly/quarterly customer listening post reviews.
- Unified Data Model for Planning. The average company with revenue greater than 5B has seven to twelve planning technologies, each running like a spinning plate. They have a different cadence. The models are not interconnected to drive holistic understanding. To build a semantic reconciliation layer, construct a unified data model, and use Celonis process mining to drive bidirectional process flows between dissimilar models. Write the output to a system of record for organizational sharing and alignment.
- Train Teams and Build Knowledge on AI Concepts. Build a training program to upskill your teams. Don’t talk AI; instead, speak the language of AI with an understanding of use cases, technology enablers, and infrastructure readiness.
- Digital Assistant (s). Use technologies from Lyric or Optilogic to build digital assistants for key personnel. Each digital assistant is a listening post to gain role-based insights. Allow roles across the demand river to continuously query supply chain master data and gain insights into questions companies do not yet know to ask. A digital assistant is a native AI network design technology embedded in a large language model to make the design more actionable and enable bi-directional query.
- Employee Training Using Large Language Models. Build a multilingual training model that enables employees to move data from portals into more usable large language models (LLMs). Consider including definitions of organizational-specific language, acronyms, training materials, supplier and manufacturing capabilities, competitor information, market share insights, etc. Constantly feed the supply chain master data into the training module to keep it up to date. I worked with a company to build an LLM for training, saving them 5M in charges to Accenture for Accenture Academy.
- Supply Chain Planning Master Data. Build a supply chain planning master data layer to analyze market data. Use machine learning to understand the median/mean values and the variability of inputs to supply chain planning, including lead time, conversion rates, commodity prices, production/manufacturing capabilities (speeds and feeds), supplier reliability, tariff factors/rates, etc. Read, analyze, and transform the data to plan batch processes for each run. Feed the plan and the digital insights layer with the insights.
- Native AI Supply Chain Design Platforms. Consider replacing your legacy design tools, such as AIMMS, Llamasoft, OMP, and Blue Yonder, with faster, easier-to-use solutions from Lyric and Optilogic. Run these design/what-if analyses with each S&OP cycle to design the supply chain, including parameters such as (but not limited to) buffers, push/pull decoupling points, inventory strategies, policy decisions, inventory run-out plans, and potential sourcing strategies.
- Sales and Operations Planning Execution. Build a platform to host playbooks (likely scenarios from S&OP discussions). In S&OP, instead of building one plan, build multiple scenarios based on team discussions. To drive an S&OP Execution process, implement a process where a small team calls playbook audibles to make weekly decisions based on tactical planning scenarios. (Much like football teams call plays in a huddle.)
- Implement Demand Planning based on Demand Flow. The most advanced thinking in this area is within o9 Solutions. Watch this YouTube series for insights and then use the graph to model multiple demand flows using market data. Focus not on error reduction. Instead, measure Forecast Value Added by stream.
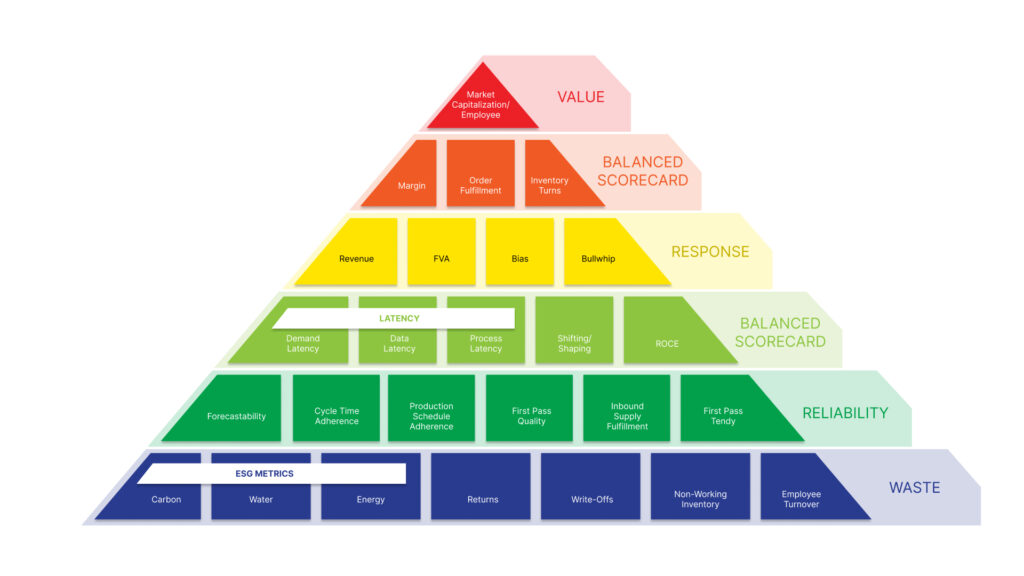
- Focus on Reliability. How Good Is Your Plan? Analyze your current planning processes. Shift the focus from functional metrics to building a balanced scorecard and then evaluate the reliability and planning effectiveness of current outcomes. Here is a list to get started:
- Focus Metrics/Incentives on a Balanced Scorecard. You are what you measure. Shift bonus incentives from functional metrics to align with a balanced scorecard. The metrics that we find drive the greatest value (market cap/employee through work with Georgia Tech) are Annual Growth, inventory turns, operating margin, customer service (on time and in full), and Return on Invested Capital (ROIC). Measure and compare the patterns of each supply chain to industry potential.Inventory Health. Analyze current inventory health and evaluate safety stock levels using insights from the planning master data layer on lead time variability.
- Bullwhip. Use network design technologies to develop different scenarios and measure the bullwhip effect. Translate the impact of the options on operating margin, customer service, and growth.
- Production Plan Adherence. Calculate production plan adherence and understand the deviations.
- Forecast Value- Added (FVA). Shift from measuring demand error to Forecast Value Added (FVA). Drive continuous improvement programs to improve FVA.
- MRP Value-Added. Apply a similar process for FVA to MRP. Analyze the value of current MRP practices to a naive material plan.
- Success of First Pass Tender. One issue with traditional approaches to transportation planning is the focus on the lowest cost and the lack of accountability for a feasible plan. Track carriers that are granted lanes based on cost, and do not pick up loads when assigned to them. Track the impact on costs and customer service, and reassign lanes based on a multifactorial analysis of both cost and carrier reliability.
Here is a metrics hierarchy to consider when driving operational reliability.
Unsolicited Advice
Don’t buy large planning platforms right now. There is too much change happening.
Also, don’t buy software from a consultant. I have never seen a consulting company successful in building and maintaining software.
Instead, try these small projects to maximize the value of current technologies. As you conduct your assessment, consider how you apply the right techniques to solve your problems and drive insights. There is no ONE right answer.
Heuristics are fast, but not deep. Optimization yields solutions to problems you can model with known structures, given a well-defined objective function. Optimization is slower, but deeper than heuristics. In contrast, Machine Learning gives you predictions from data you can’t model analytically (without an explicit model). Most real problems need a combination of these techniques. Put heuristics to work for image recognition, data mining, and pattern recognition while deploying AI within deeper mathematical engines in optimization for faster and deeper answers using reinforcement learning, deep learning, and gradient descent. (The list of techniques is long and evolving.)
Don’t confuse what-if analysis with discrete event simulation. Both are becoming easier to use and deploy. Discrete-event simulation is more difficult, but it is useful to test the feasibility of a plan.
Work with your data scientists to identify problems and align the right techniques to drive insights. When you ask your technology providers how they use these techniques to drive better insights, put a data scientist on your project team and ask the technology team to outline their future roadmap that integrates these approaches.
Don’t myopically focus on engines. Instead, broaden the discussion to include disparate data sets, model types, synchronizing data at different velocities, and building the planning master data and semantic reconciliation layers.
And, stop anyone who mentions the Gartner Magic Quadrant or any other fairy dust framework. They just are not relevant right now.
Summary
So, Vijay, how did I do? Anything to add?
Good luck in your journey.