
Lora's Latest Post

Patterns Tell the Story of Supply Chain Excellence

Pattern recognition is the ability to discern patterns in data and use the insights for further analysis.

Wikipedia

In 2014, I was exploring methods to publish what is now the Supply Chains To Admire report. Fortuitously, I hired a bright summer intern named Alex that introduced me to orbit charts. The use of orbit charts allowed me to see the patterns of performance at the intersection of metrics over time. By charting the performance against peer groups, I could see the story. For the past decade, I have been studying these patterns.

The first step was to find a reliable data set and establish the peer groups. We purchase data from Y charts. (A syndicated data feed used for financial analysts. This data source synchronizes corporate reporting across global markets while tracking restatements, name changes, and currency shifts.) We have archived corporate reporting from Y charts for 1982-2023.

The second step of establishing peer groups was trickier. It took us four years to establish what we believe are representative peer groups based on the performance patterns. We experienced enormous issues with NAICS and SIC codes. To build the peer groups, we asked business leaders to tell us who they thought was a reasonable peer group. There is no perfect methodology, and the peer group discussions continue.

Studying Performance of the Gartner Top 25 Award Winners

Plotting corporate patterns against peer group performance through orbit charts enables a quick understanding of supply chain excellence. Consider Lenovo in Figure 1. Lenovo ranked as # 10 on the Gartner Top 25. As an aside, I do not think that Lenovo is an example of a supply chain excellence. Look at this orbit chart and let me know your feedback.

Figure 1. Year-over-Year Performance of Lenovo Compared to the B2B Technologist Peer Group
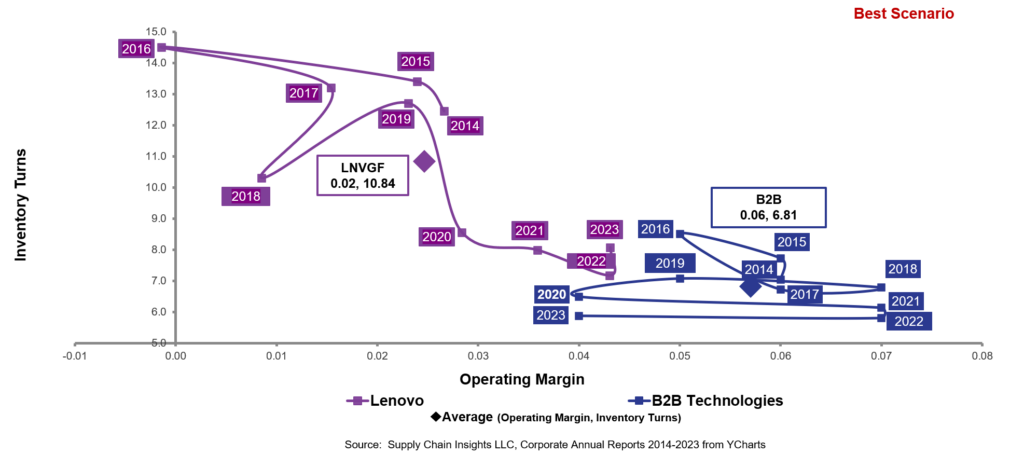
The first part of the story is Lenovo drove considerable improvement in margin in a tough period of 2020-2023, but the company is underperforming the market on margin. Lenovo posts a 2% average margin compared to the industry average of 6%. The second part of the story is that inventory turns for Lenovo are 10.8, but declining.

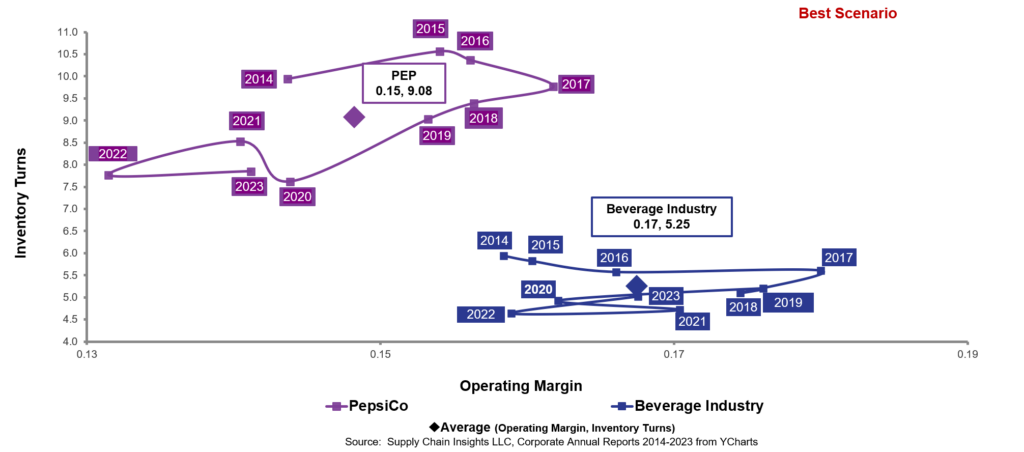
Let’s take a look at PepsiCo. Ranking at #13, PepsiCo outperforms on inventory turns, but performance is declining. The company underperforms on margin.

Figure 2. Performance of PepsiCo Compared to Beverage Peer Group for the Period of 2013-2023
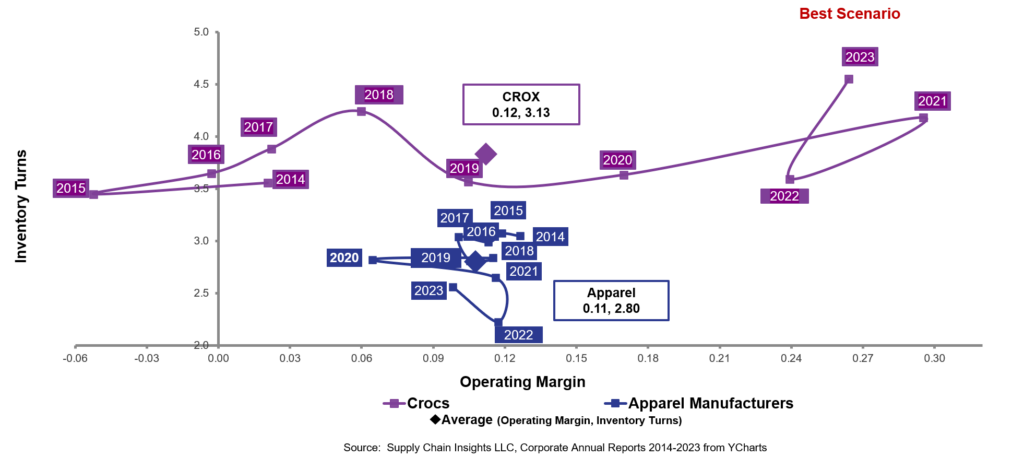
Now let’s compare these patterns to a company driving improvement and outperforming. In Figure 3, we depict Crocs. The Company drove a pattern of improvement year over-year surpassing the industry in the 2019-2020 period. The secret? Innovation in plastic shoe design, and the design of the supply chain to maximize value.

Figure 3. Pattern of Crocs Performance for the Period of 2013-2023 at the Intersection of Operating Margin and Inventory Turns
Wrap-up

I hope that this helps. I hope you find the patterns as useful as I do.

Let us know if you would like for us to chart your company. A useful technique is to chart divisions against the industry peer groups.

If you are in the US, have a great Memorial Day! I will be slinging mulch bags in my garden. I have two pallets to throw over the next two days. Hopefully, I will be able to walk on Tuesday for my client strategy day.


Search the Archives
Search
Share this Post
Email
Twitter
LinkedIn
Facebook
Pinterest
WhatsApp
Featured Image
Recent Posts

Is your Supply Chain AI Ready?

A simple quiz to assess an organization’s AI readiness.

The pace of change is fast and furious. Every day, technology advances faster than we can digest. A great challenge to have.

Determining whether a supply chain is “AI-ready” is less about technology and more about the gray matter between the ears of supply chain leaders. Leadership, alignment, and clarity of goals matter.

Too few companies are clear on the definition of supply chain excellence. Measuring and rewarding functional metrics reduces the firm’s value. Putting agentics on top of today’s processes can make bad practices run faster, reducing value.

The toughest job for the supply chain leader is challenging existing supply chain paradigms that were defined by the limitations of decades of supply chain technologies. As the curtain lifts on the potential of new forms of technology, process redefinition is our opportunity, but only if we are clear on what drives value. (Here, I link to the Supply Chains to Admire reports to help you define value. The next report will be published on June 23rd, along with my Dynamic Benchmarking Product, to help you define value in the face of your AI readiness. More information about the launch is at the bottom of this blog.)

Read More »

Case Study: A Scrappy Demand Management Approach

This study of Franklin Sports shines a light on the work that needs to be done at the sales account level to challenge a retail forecast, and also highlights the importance of a new technique for a forecast engine — reinforcement learning.

Artificial intelligence comes in many forms — large language models, generative AI, machine learning, unstructured text mining, deep learning, neural networks, reinforcement learning, agents, and agentics. While the industry is wigging out about agentics, I think reinforcement learning is a great step forward in the journey of Artificial Intelligence.

Read More »

Can We Side-Step the AI Spin Cycle?

When it comes to combining tech, 1+1+1 should equal more than 1. The impact should be exponential. Unfortunately, today, the answer is 0.

What do I mean? Let me explain.

I find that the supply chain technology market moves slowly along traditional technology lines. Conferences are usually focused on the use of technology, not on redefining work. This bothers me. I want it to bother you as well.

Here I share some insights to drive change.

Read More »

Supply Chain Health Check: The Power of an Orbit Chart

An orbit chart is a powerful tool for understanding the “health” of a supply chain and its potential for improvement. The supply chain is a complex, non-linear system with limited trade-offs. The relationship between trade-offs varies by industry, region, and size. The orbit chart is a diagnostic we use in the Supply Chains to Admire work. Here I explain the use case.

Read More »

Are You Writing a Check You Cannot Cash?

Don’t let a well-intending, but ill-informed consultant or technologist set an expectation that you cannot meet. No when wins when there is a check written that cannot be cashed. In this case, the consultant will move to the next account leaving you holding the bag. Fight back with a data-driven argument. Help the organization think about inventory more holistically.

Read More »