I remember the 2007 stock market drop like it was yesterday. I was working in Boston and staying at the Westin Seaport hotel. BAM! Overnight, the hotel went from being sold out to empty.
Restaurants closed, hallways echoed with emptiness, and services that were normally available were quickly shuttered. Purses slammed shut, layoffs ensued, and customer sentiment plummeted. Scary indeed.

At the time, I wrote furiously about the lessons to be learned, but I’ve found the industry has a short memory. Then I was optimistic leaders could learn from the downturn. Sadly, not. We are in worse shape today than in 2007.
Reflection
In 2007, I also recalled the 2001 downturn. In 2001, I was a Gartner analyst, and the global market reaction to Cisco’s $2.25 billion write-off of equipment sourced to support the rise of e-commerce, but not needed when the e-commerce market cooled, was a big story. GASP!
My fingers quickly typed the stories of how the crisis exposed major weaknesses in supply chain information sharing, inventory management, and planning. Leaders struggling with the 2007 downturn had largely forgotten the Cisco write-offs and the market downturn that followed the e-commerce bubble burst. A major downturn has been almost two decades. Companies do not have downturn prep in their organizational memories. It is easier to power a supply chain through growth than a market downturn.
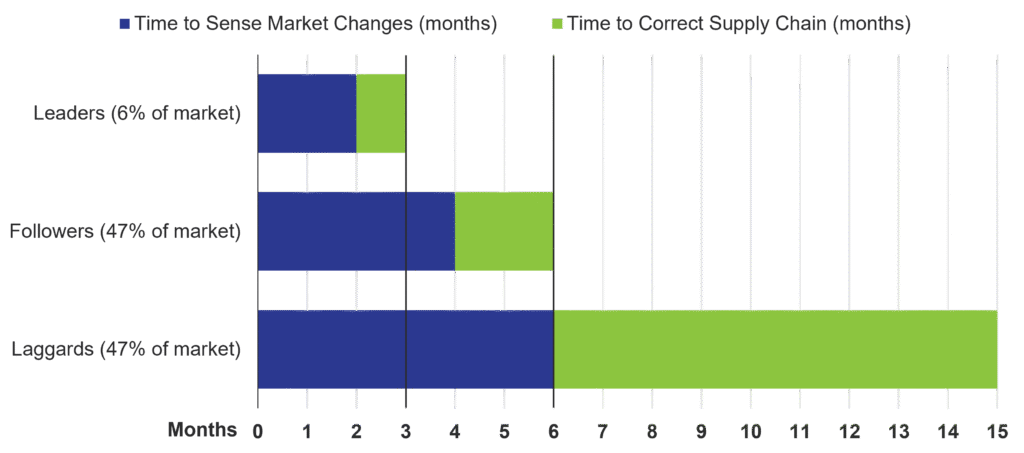
In 2007, the average company took six months to sense market shifts and adapt its supply chain. Figure 1 is based on qualitative interviews with thirty manufacturers in 2008. My estimate, based on work with clients, is that if a downturn happened today, the average company would take 20-30% more time to adjust than in 2007. Let me explain.
Figure 1. Time to Sense and Adjust Supply Chain Operations in the 2007 Economic Downturn
Current State
Over the last two decades, technology spending in supply chain management has become more insular, with tighter integration into transaction systems. Systems are now more aligned by function, and the gaps between functions are larger. The metrics are functional and misaligned with balance sheet performance. Placing agents on top of traditional supply chain architectures makes a company more reactive.
Based on my research, fewer companies are innovators. Most believe that historic processes are best practices.
Network visibility is an issue. Over the decade, network capabilities consolidated, but have been slow to innovate. The transportation visibility sector shows promise— the architectures are newer and the business problems clearer—but companies still don’t use transportation data well in planning. Using the data requires an architecture redesign.
Transportation Data is a Market Health Predictor
In discussions with supply chain leaders, most believe that the global stock market is overheated with AI spending. Just as we have forgotten the lessons of the pandemic, few leaders remember the political drama of large stock market drops on the supply chain.
Supply chain architectures aren’t built to plan easily when there are knowns and unknowns. The traditional focus is optimization of known inputs to known outputs. As a result, when the market dips, chaos ensues.
One of the best sources of demand data comes from transportation reporting. Here are some current trends.
- Ocean Capacity. Ships sitting in the Strait of Hormuz tie up global capacity. The rise of global shipping volumes amid geopolitical friction—especially in Asia—has created trade imbalances. Ocean shipping reliability now hovers around 60-65%, down from pre-pandemic norms of 70-80%. Roughly 8% of global ocean container ship capacity is now unavailable due to shipping inefficiencies. As inefficiencies rise, costs escalate and lead times are more variable. Ocean container equipment could easily become a constraint.
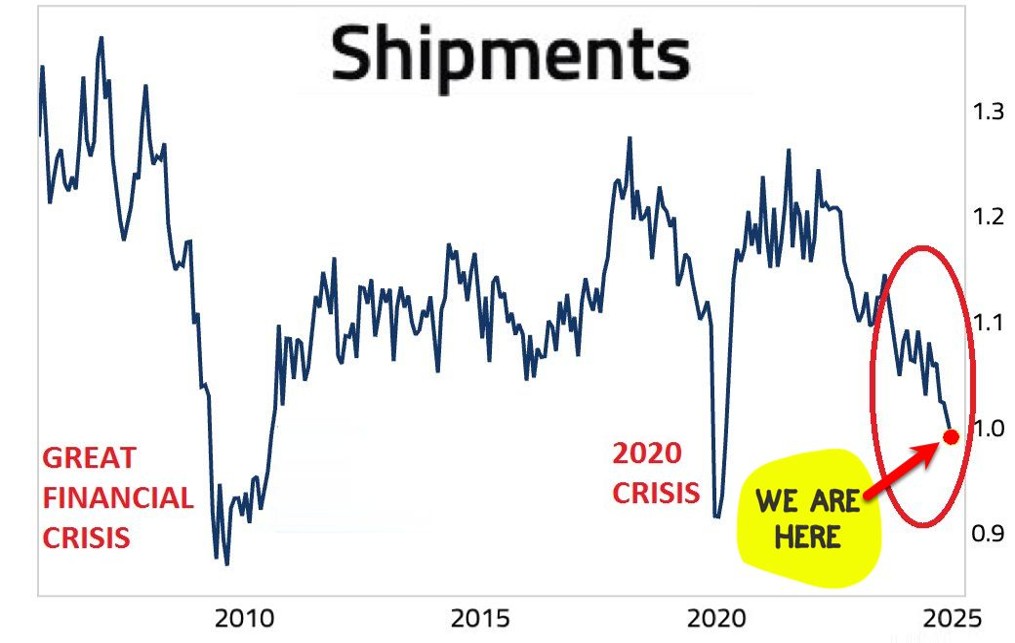
- Downward Trend of Shipments. The Cass Freight Index shows a twenty-eight-month decline in North American Shipments. Shipments are falling — consumers are buying less. The North American markets are slowing, and the US/Canadian trade talks are problematic. Note the downward trend and compare it to the 2007 and 2020 data.
Today, the public markets are buoyed by investments in war machinery and armaments and data centers to support AI. Is this reminiscent of the ecommerce bubble of 2001? No one knows, but it is possible. Companies need to remember that history — neither order history nor shipment history — is a good predictor of future demand. But a trend like this is a wake-up call.
Figure 1. North America Shipments: Cass Freight Index
Steps to Take
The first step is to align your supply chain with market data — from the customer’s customer to the supplier’s supplier. Investigate your organization’s transportation data sources and start projects with your data science teams to understand your goods’ shipment history against market drivers.
Step 1: Focus on latency reduction. Chart the latency in your supply chain based on demand flows using the definitions in Figure 2. (A demand stream is a distinct pattern for groups of items as defined by frequency and quantity of items ordered, lifecycles, forecastability, and demand shaping programs.)
Figure 2. Recognizing and Defining Supply Chain Latency
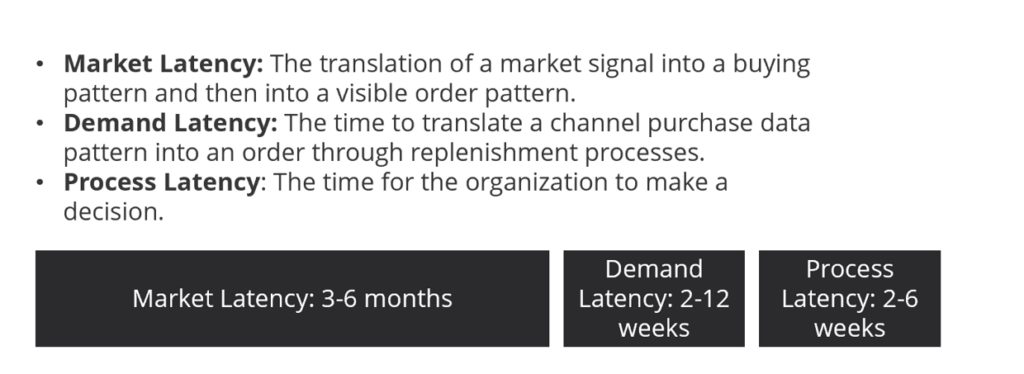
Align Demand and Supply Cycles. While most supply chain leaders can easily grasp the concept of matching demand and supply volumes, more mature companies match demand and supply cycles. Let’s take an example. For one of my clients, market latency was four months for their top-selling item, demand latency was 10 weeks, process latency (time to decide) was six weeks, and the supply cycle was two weeks. Yet, the customer was forecasting using their shipment data. YOWZA, I thought when I explained to the customer that they were making a supply chain planning decision twenty-eight weeks after a shift in consumer buying patterns. Too little, too late.
Simplify Demand Shaping Programs. The client’s demand and process latency issues were exacerbated by the number of demand-shaping programs. Unraveling the impact of the unchecked complexity in demand shaping (promotions and rebates) adds to process latency.
Drive alignment. Get clear on terms. The goal should not be real-time decisions. (You may have streaming data that is near real-time, but the data input pattern needs to match the goal of each planning horizon.) Focus on how to make decisions within each time horizon — frequency, granularity, and horizon. And importantly, define what makes a good decision. Focus on making decisions at the speed of business in each planning horizon.
Figure 3. Time Horizon Discipline
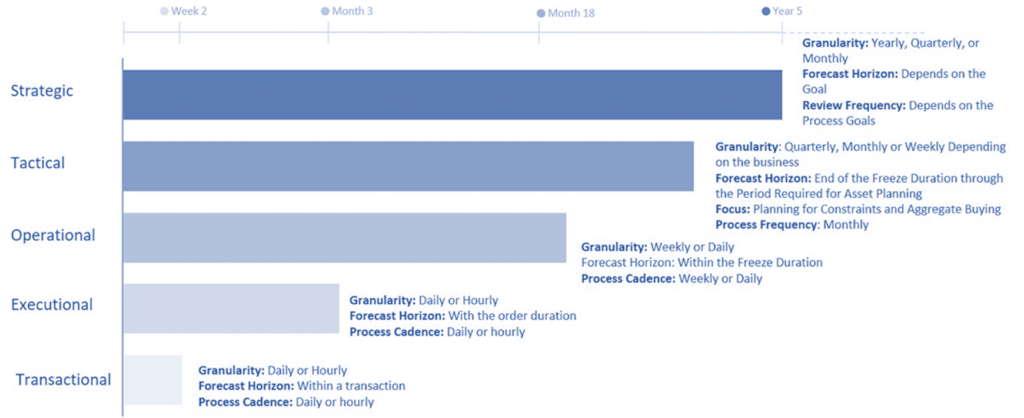
Define how long it takes the organization to make a decision today. Clarify who should make which decisions, and focus on streamlining the process. For example, for one client I work with, when a business leader asks a planner a question, it takes a couple of days to receive an answer to a minor question. But if the question involves decisions on capacity or inventory allocation, the decision can take weeks. The larger the organization, the greater the issue. So, focus on process improvement to help business leaders get to the information they need to run the organization.
Shift the focus from “integration” to “interoperability” and “orchestration.”
- Integration: Specific interfaces to move data between systems in a meaningful format.
- Interoperability: Exchange of data and process semantics without custom interfaces, based on common standards, protocols, and formats.
- Orchestration: Coordinated process workflows across and between functions and processes.
Understand what is possible and feasible. Accept the reality that the industry potential (average performance) of sectors at the intersection of operating margin and inventory turns is lower today than pre-pandemic in 80% of manufacturing industries.
Wrap-up
These steps help minimize supply chain market shock waves, but more importantly, they make good business sense. What do you think? Reach out if you have any questions.
Sources:
Sea-Intelligence – July Global Schedule Reliability Drops to Lowest 2026 Level