 …the weekend is just around the corner. Happy Valentine’s Day to all my blog readers. This is my 440th blog post and the tenth anniversary Supply Chain Shaman. It seems hard to believe that I have been typing away over all these years building an audience of over 20,000 global readers.
My friends would tell me to relax and get my Groove on ;but, today, I find myself deep into a presentation for a client’s design thinking session next week. I am delving into COV (coefficient of variation) analysis. So, as I tap my foot to the music, I am substituting COV for groove. I think that more companies would benefit by getting their COV on… Let me explain.
Getting Your COV On…
The Coefficient of Variation is the ratio of the standard deviation to the mean. It is useful to analyze demand data to understand “forecastability” and randomness. Not all data is forecastable, and not all demand optimization engines are equal. The more forecastable the data set, the easier it is to find an optimizer. With a lower COV, the process is easier and the required skill level not as high.
It is for this reason, that I use COV analysis to type logical supply chain flows. Using demand classification logic, you can understand the rhythm and flows of demand. …and hopefully get your groove on.
Companies do not have one supply chain, they have many. There are usually three to seven supply chains. The tactics need to align with the flows based on volume and variability. Most supply chain leaders cannot get their groove on because they generalize–the use of the same metric targets and tactics for the supply chain without paying attention to the flows. Typically, the focus is volume-based segmentation with a bias to build supply chains for predictable and high volume products. This is problematic because sometimes the low-volume products are mission dependent. This is the case for samples.
Let me give you an example of a client where a low volume product was critical to brand positioning. The client manufactured baby formula. The goal was to build brand loyalty by giving a new mother the formula product in the hospital. The concept was simple, but the execution was flawed. The concept was to build brand loyalty at birth. The problem? The company focused only on high volume product to retail. The product was losing market share to competitors because the company was shorting the shipments to hospitals of the samples for new mothers.
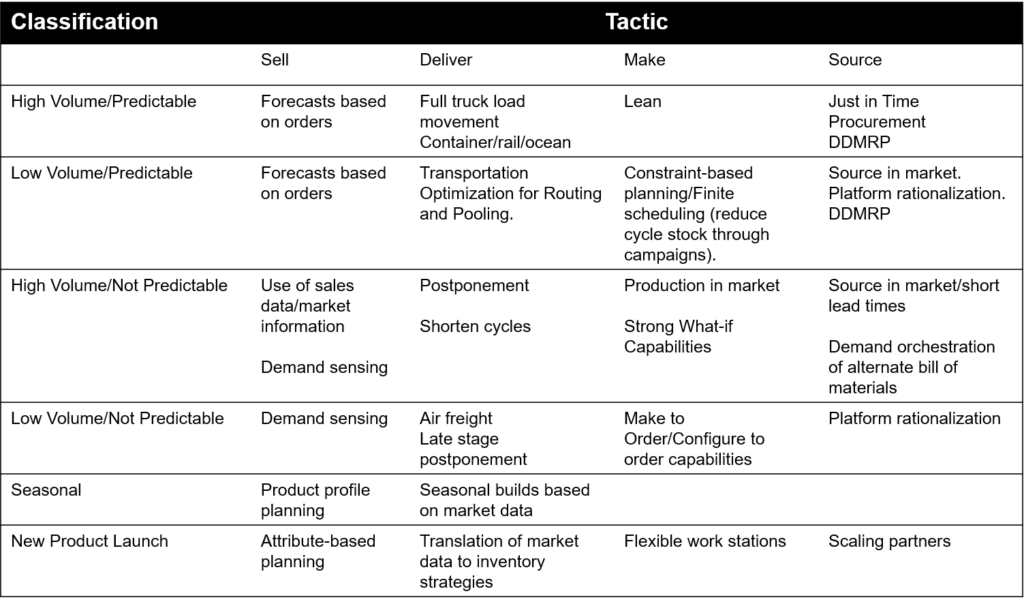
Here is how I build the demand classification logic. Start with high volume and predictable demand. Most companies have a high volume and predictable supply chain (COV of less than .5), an intermittent supply chain (COV of .5-1.5), and a supply chain that is less predictable (greater than 1.5). In addition, there is often a seasonal group of products, new product launch streams and a service supply chain logical model. To be successful, each logical supply chain model needs different tactics. In Table 1, I share an example of assignment of tactics from a customer session. While the table was quickly generated in group discussion and is not perfect, it is designed to help the reader understand the logic.
Table 1. Sample Use of Tactics Per Supply Chain
 Discussion on Demand
When companies tell me that their demand variability increased over the last decade, I ask why. I want to know the drivers. Most cannot answer the simple questions. Organizations have a better understanding of supply than demand.
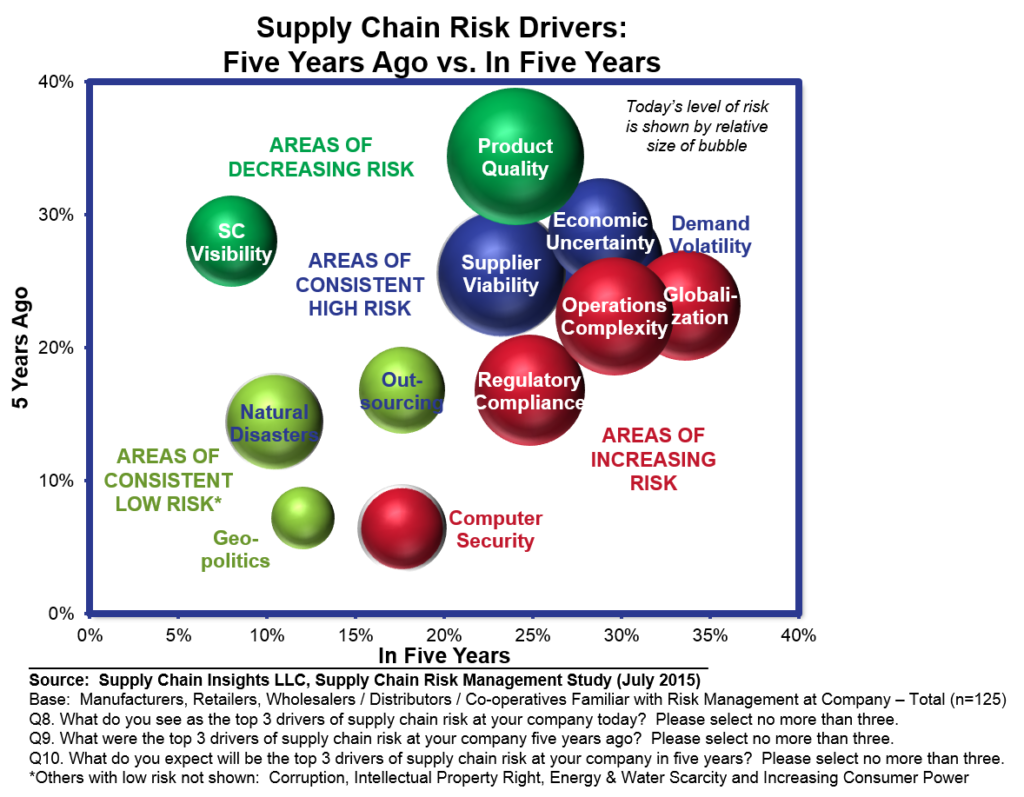
In Figure 1, I share data from the risk management study of 2015. Note that at this time, demand volatility risk was larger than economic uncertainty. However, as an industry, have made little progress to mitigate demand variability as a supply chain risk. The answer is more than simple demand planning techniques. Making the shift is a change management opportunity for companies to move from a supply-centric thinking to think about demand as a river that flows through the supply chain. The COV helps business leaders to understand the rhythm of the river flows. To make this journey requires the building of outside-in processes from the market and orchestrating the signal seamlessly across make, source and deliver. This is a radical shift from the functional orientation of traditional supply chain thinking.
Figure 1. The Role of Demand Variability in Risk Mitigation from the 2015 Study
When I delve into the data, I find:
- Forecasting Solution Signal Efficacy. Nine out of ten demand planning solutions I test are not improving the forecast (using Forecast Value Added analysis with the definition of a naive forecast as a three-month average of shipments.) Most initial deployments will lift, or improve the forecast error by 7-12%. Over time there is degradation. It is usually not one issue, it is the combination of data cleanliness, optimization tuning, and employee understanding/training.
- Elongation of the Supply Chain Tail. Product proliferation results in lower volume per item. Supply chain design is normally focused on high volume products, and traditional techniques are is unable to adapt to shorter cycles.
- Measurement. Companies struggle to measure demand accuracy. Many companies mistakenly measure demand error at a “national” or a “customer level” at a “product family” level. This is insufficient for supply chain planning. Supply chain processes require accurate data at a item/shipment level. In addition, bias is an issue. In growth companies, the forecast is usually under-forecasted while in a down market there is usually a positive bias, or the tendency to over-forecast.
- Supply-Centric Thinking. One of the largest issues is supply-centric thinking. This includes:
- A,B,C Analysis by Volume. This analysis is blind to demand variability.
- Generalization of Tactics. Supply chain leaders love shiny objects–new technologies and processes. They tend to jump from one fad to another. As a result, tactics are applied across the supply chain without alignment to volume/variability analysis.
- Wrong Metrics. In a supply-centric model, weighted MAPE is sufficient (WMAPE), but as the long tail increases, companies need to focus on MPE and MAPE. Weighting error hides the issues of intermittent demand.
A Side Discussion on MAPE and WMAPE
In the discussion of MAPE versus WMAPE, to make the point, I use the example of prem ature babies in the hospital. (At this client, they are shorting one out of two orders due to short shipments of intermittent demand. They feel over-confident in supply chain performance because WMAPE hides the issues of demand variability with lower volume shipments. (In this client example, WMAPE of high volume predictable products is 26% versus 76% when measured at a MAPE level.)) On average in the US, 11.5% of children are born premature. Premature children require extra precautions (a different supply chain of sorts). I then ask the group a question, “Would it be acceptable to drop one out of every two premature babies from their neonatal units? You are what you measure….
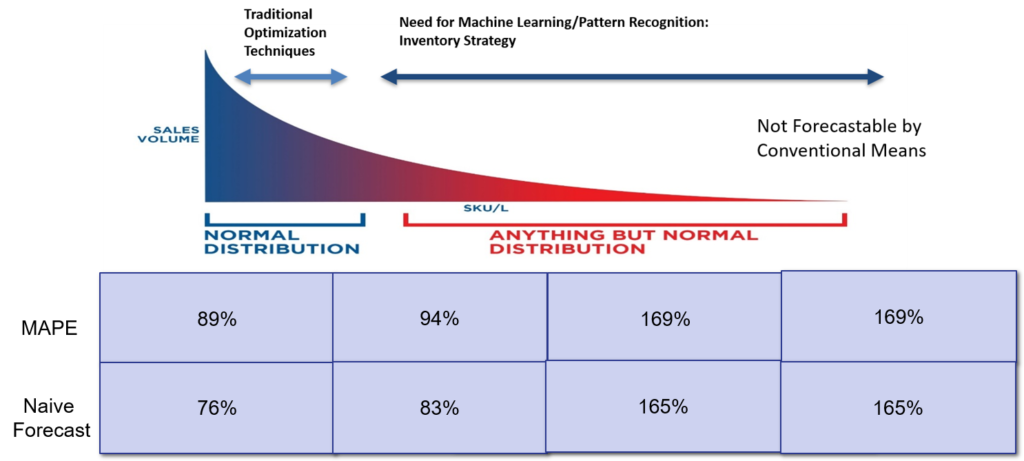
Back to my client case study. In Figure 2, I share their current state of FVA analysis across the tail. The client analysis supports that at no point in the product tail is the forecast generated by their current technology and processes better than the naive forecast; yet, all the client wants to talk about is the roll-out of the current technology globally. In this discussion, I scratch my head.
Why are they not more focused on using decision support to get a better answer? And, why is there not a focus on fine-tuning the engines and applying different demand planning techniques. The answer lies in the truism, “You manage what you understand.” All too often the focus is on implementation, not getting better answers.
Demand planning is all about attention to detail at an item/location level. As the COV increases, the engine sophistication needs to change, and the organization must always answer the question, “Are my processes and technologies improving forecast error and bias? And, how does the supply chain variability affect process flows? Then based on volume and variability, what are the right techniques to apply to each supply chain?”
Figure 2. A Client Case Study
Yes, I strongly believe COV helps companies get their groove on… It helps companies understand the rhythm and flows of the supply chain dance…
All I can say is shake it on this Valentines Day. Dance to the rhythm…
I look forward to hearing your feedback.