
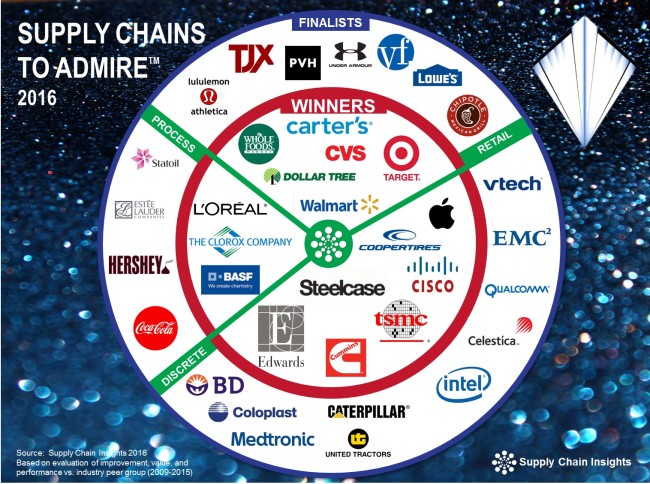
 Five months of analysis. Lots of heated debates. It is now over. This morning we announced the Supply Chains to Admire Winners and Finalists for 2016. The research starts in April and stretches over many weeks as we analyze the different elements and understand the patterns of each industry.
Why do we do it? Selfishly, we need a standard for our research, but we also want to help supply chain leaders gain new insights from a deep data-driven analysis. There is no agreed-upon standard for supply chain excellence. Leaders agree that it is easier to say than define. A clear goal is needed to drive progress. The answer? We think deep research to help companies determine benchmarks and set goals.
Background.
The Supply Chains to Admire analysis is now in its third year. It is data-driven research: a deep analysis of performance, improvement and Price to Tangible Book Value of 320 companies across 31 industries for the period of 2009-2015. The source data for the analysis is public reporting of balance sheets and income statements.
To determine the winners, we compare the effectiveness of each company against relative performance within an industry-specific peer group. We determine which companies have driven higher levels of improvement (based on Supply Chain Index calculations) and shareholder value (as defined by Price to Tangible Book Value) while outperforming their peer group on growth, operating margin, inventory turns and Return on Invested Capital (ROIC).
Figure 1. Supply Chains to Admire Methodology

The Results
In the analysis, we divide companies into three groups: winners, finalists and underperformers.
- Winners. The winners of this analysis meet all of the criteria of improvement, value and performance when compared to a like industry peer group. Sixteen companies qualify against this criterion. This is a high-performing group representing 5% of public companies studied.
- Finalists. A finalist drove higher levels of improvement, and value, and are within 10% of the industry average on three out of four of the performance factors, and no more than 25% below the mean on any of the four factors of growth, operating margins, inventory turns and ROIC. Twenty-one companies meet this criterion. In this analysis, 7% of companies studied are finalists. The combination of finalists and winners equals 12% of companies studied.
- Underperformers. The winners and finalists are an elite group. 88% of companies do not meet the three criteria of improvement, value or performance. Unfortunately, we find most companies are moving backwards on the Supply Chain Metrics That Matter™ or making progress on singular metrics versus driving performance improvement on a balanced portfolio of supply chain metrics that correlate to market capitalization. (If you see one of my presentations, I am sure that you remember the gnarly patterns of the orbit charts.) This includes industry icons that are often referenced as best-in-class supply chains. (When you hear an industry consultant speak of a top performing supply chain, trust but verify. Check out their performance by plotting year-over-year metrics at the intersection of two ratios and look at the patterns. We find the patters and the intersection of inventory turns and operating margin and growth and Return on Invested Capital to be insightful.)
Figure 2. Results of the Supply Chains to Admire Analysis
There are no winners or finalists in the industries of aerospace & defense (A&D), automotive, automotive suppliers, conglomerates, consumer durables, ecommerce retail, hospitals, over-the-counter drugs (OTC), packaging, pharmaceutical, third-party logistics or toy industries. Similarly, industries like beverages, contract manufacturing, food, oil & gas, restaurants and fast food, and retail apparel have finalists, but no winners. We find it ironic that the industries with the greatest challenges—high-tech & electronics—post the greatest progress, while industries with slow market shifts—household products, food, and beverage—are regressing.
What Drives Value?
In the report, we wanted to determine which factors correlate to Price to Tangible Book Value (PTBV). We wanted to answer the question of, “What Should Supply Chain Leaders Do to Drive Value?”
As a part of this analysis, we wanted to answer the question for supply chain leaders on what drives value. To answer this question, in parallel with the Supply Chains to Admire research, we mined our quantitative data to answer the question of, “What steps should companies take to improve PTBV?”
In the analysis of the Supply Chains to Admire, we use PTBV as a proxy metric of value. We believe that improving the value of shares outstanding in relationship to assets and tangible book value is within the control of the supply chain leader. The definition of PTBV is:
Price to Tangible Book Value = Market Share Price / Tangible Book Value/Shares Outstanding
To help the supply chain leader reading this report, we wanted to use our survey database to understand the relationship between strategies/process options and improving PTBV. (Through this analysis, we find that companies that have a successful Supply Chain Center of Excellence, an effective S&OP process, and have less business pain with supplier reliability drive greater PTBV performance. In the spirit of transparency, in Figure 3, we include the correlations of these factors to PTBV. In addition, factors considered, but had a correlation less than r=0.30 and greater than -0.30 are included in the full report. Check it out! As many commonly held factors, like a single instance of ERP, do not show a pattern of correlation to PTBV.
Figure 3. Steps to Take to Improve Price to Tangible Book

What Can We Learn from the Research?
When we interview companies making the Supply Chains to Admire list, we find commonalities and similar patterns. These are shown in Table 1.
Table 1. Characteristics of Supply Chains to Admire Leaders

These companies have longer tenure of their leadership teams with a focus on long-term outcomes. In addition, there is consistency in direction. The teams sidestep fads with a dogged focus on supply chain excellence.
Complexity hampers results. In our analysis, we also find that these companies are more focused on the management of complexity through the adoption of customer segmentation, cost-to-serve analysis and item rationalization. They are better at horizontal processes, supply chain planning and network design (form/function of inventory).
Over the course of the next six months, we will be sharing case studies of these companies in our conferences, podcasts, webinars, and writing. We want to raise the level of discussion on supply chain excellence and get out of the trap of blindly defining legacy processes as “best practices.”
For details check out the full report on Supply Chain Insights. Winners will be featured on the podcast Straight Talk with Supply Chain Insights and at the Supply Chain Insights Global Summit on September 7-9, 2016 in Scottsdale, AZ. We hope to see you there! Please join me in congratulating the top 12% of supply chains that are driving improvement, value and higher levels of performance on the Supply Chain Metrics That Matter.