Mush is a thick cornmeal pudding boiled in water or milk. It sits until the gel forms a semisolid state. In the United States, we lick it up with maple syrup or molasses, while in Eastern Europe it is served cold. It is a tasteless, innocuous food with little form or satisfaction.
Mush in the Real World
Last week, the Gartner Top 25 was announced with great fanfare. The announcement marks a decade of Gartner Top 25 annual lists. I hope that it is the last one. My reason? It is just mush. I find the Gartner Top 25 to be a muddled methodology that is boiled and allowed to congeal into a bland product with little use.
Here, I would like to share my thoughts…
The good thing about the Gartner Top 25 was that it highlighted the need for a measuring stick. Supply chain leaders are competitive and they want to measure their success. They want to do well, and they are eager to have an objective measure. However, here are my concerns:
1. Meaningless Comparison. The first, and my major issue with the Gartner Top 25 methodology, is that it attempts to compare all companies in a spreadsheet. I just don’t think the comparison of very different industries in a spreadsheet based on growth, inventory values, and Return on Assets (ROA) is meaningful. The methodology unfairly favors companies that do not have assets. It is for this reason that the high-tech sector and franchise businesses do well on the methodology. The reason why? They have shed their assets. In many businesses, assets are a core part of the supply chain. Take the chemical industry. I like what BASF has accomplished, but they will never make the top listing on the Gartner Top 25. The reason is that as a chemical company, they must run assets, and the methodology penalizes companies with deep asset strategies. To be valid, I believe that companies must be compared within a peer group.
2. It Should Not Be a Beauty Pageant. For five of the past ten years, I voted on the Top 25 when I was an analyst at AMR Research (before the acquisition of AMR Research by Gartner). The more work that I do on trying to understand corporate balance sheet information and the connection to supply chain excellence, the more I realize how unqualified I was to vote.
Fifty percent of the Gartner ranking is based on opinion. It is both the opinion of analysts and peers. When I voted then, I never felt qualified. I am even more convinced now that my vote was irrelevant. The environment for the analyst is worse today. Over the past decade, companies have lobbied the Gartner analysts for higher scores. Public Relations firms have mounted campaigns. I think that the discussion on supply chain excellence should be a data-driven discussion.
3. It Should Be More Applicable. The Gartner Top 25 methodology is focused on very large companies. There is no methodology in the market today that applies to companies that do not qualify for the Global 1000. I feel that there needs to be a methodology that is applicable to the greater market.
4. The Supply Chain Is a Complex System with Increasing Complexity. As a result, the metrics have to be viewed together as a pattern over time. I think that the duration of time in the Gartner Top 25 is too short to measure tangible results. In summary, supply chain progress takes patience and discipline over many years. In the journey, the supply chain leader needs to improve the potential of a portfolio of metrics. The metrics of growth, Return on Invested Capital, Inventory Turns and Operating Margin have the highest correlation to market capitalization. I find value in looking at these metrics together. Managing the supply chain is about trade-offs. These metrics are inter-related and the relationships are not linear.
5. Can We Really Determine Who Does It Best? The methodology attempts to understand and identify the “best supply chain.” I question this as a goal. Instead, I think that our goal should be to measure improvement. I think that the “best supply chain” is based on business strategy and as such, cannot be measured. (e.g., What is good for one company may not be right for another.) However, I do think that we can measure supply chain improvement by looking at balance sheet data.
Let me give you an example to explain my point. I am training for a triathlon. It is a small one: an Olympic format in December where I will swim .7 miles, bike 22 miles, and run a 10K. I am no spring chicken. As an overweight lady of sixty, I will never post the scores of a Lance Armstrong. Yes, you got it. We are at very different levels of potential. His is very high and mine is very low.
Measurement is possible in athletic endeavors independent of performance level. I can measure if I am getting better, and Lance can measure if his training is making him better. We can measure the impact of our workouts on the output of heart rate recovery, calories burned, BMI, ratings on our power meter on the bike, and cadence. Day-by-day we both can see progress on strength, balance and endurance. I wanted to do the same thing for the supply chain leader.
Today, it is tough for a supply chain team to assess if they are getting better. They work hard, but the balance sheet data is so complicated, that it is hard to see if they are making progress.
It is for this reason that we are busy at work on the Supply Chain Index.
What is the Supply Chain Index?
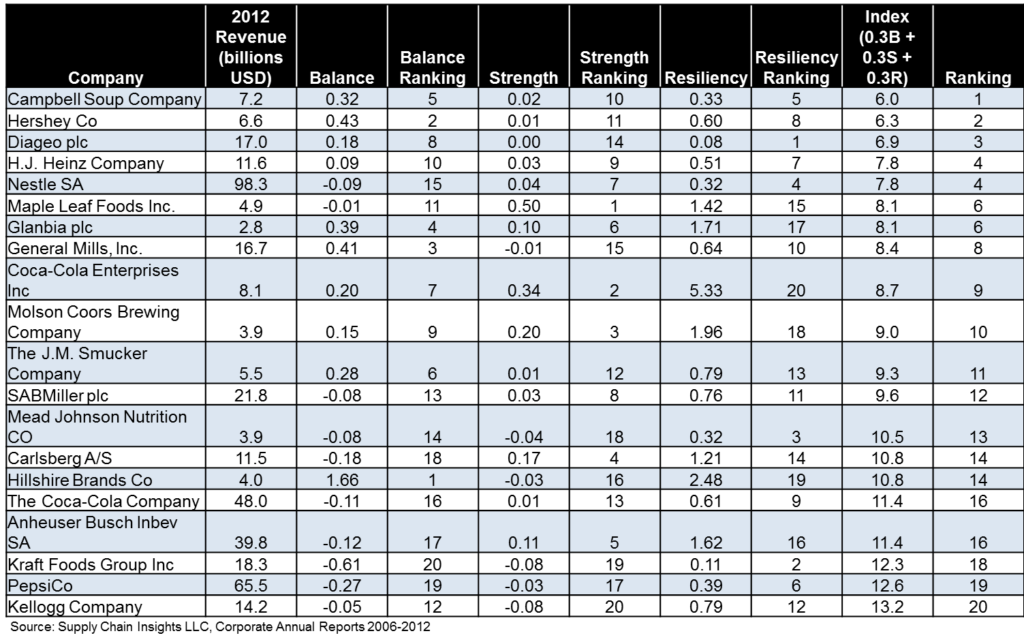
Figure 1.

Figure 2.

It is our attempt at Supply Chain Insights to change the discussion to be a data-driven dialogue on supply chain improvement. For the last three years, we have been plotting corporate financial data and studying the trends. This culminated over the course of the last four months into a methodology that we developed along with the Operations Research team at Arizona State University. They applied the right mathematical techniques to read the patterns to see if supply chains are more balanced (greater progress at the intersection of growth and Return on Invested Capital), making improvements (getting stronger at the intersection of operating margin and inventory turns), and if they are resilient (a tight predictable pattern with reliable year-over-year results). The larger the value for balance and strength in the two tables the better, and the smaller the number on resiliency the better.
We have defined the Supply Chain Index methodology in a recent report, along with a separate report on Supply Chain Resiliency. Over the course of the summer, we will be taking a closer look at industries within each value chain. We will be plotting their progress for the period of 2006-2012.
In June, we will publish the results on the consumer value chain. Our focus in July will be on the healthcare value chain, and in August it will turn to the industrial value chain. In the preparation of the reports, we will be interviewing companies that are making more progress than their peers. After we finish all of the data collection and publish the reports, we will ask the members of the Shaman’s Circle to vote, and then we’ll publish the companies that we most admire based on their progress on improving performance. (The Shaman’s Circle votes will count 10% on the final rankings.)
Applying the Supply Chain Index
For example, let’s take the food and beverage industry that is outlined in figure 1. Campbell’s Soup, Hershey, and General Mills rise to the top. (Compare the gaps between General Mills and Kellogg or Hershey and Kraft. No one can argue that they are making more progress.)
In general, we find that the trends within an industry are greater than we could have ever imagined, and that smaller companies are making progress at a faster rate than larger ones. Value networks that are less dependent on oil are making less progress than those that are oil dependent. Companies that adopt new business models are outpacing peers. In addition, companies with consistent leadership have a more positive trend.
Summary
So, as the blogs, tweets, and articles flow from the Gartner conference, I sit back and look at the meaningless mush. I think that supply chain leaders need a more data-driven, meaningful and applicable methodology. I want to help. I would love to hear your thoughts on what we are doing.
As for the Gartner 25, I say, “Mush, Mush, Mush.” This is a term that is used in sled dog races to run fast. I hope that it goes away quickly. Supply chain is too important to be measured simplistically.
To hear more about the Supply Chain Index, and the relative improvements of companies for the periods of 2000-2012, 2006-2012, and 2008-2012, join our summer webinar series:
- June 12th at 11:00 AM on Consumer Value Chains to review the progress in retail, consumer packaged goods, food and beverage and chemical companies
- July 17th at 11:00 AM on Healthcare Value Chains to review the progress in hospital, medical device, and pharmaceutical supply chains.
- August 12th at 11:00 AM Industrial Value Chains the review of semi-conductor, industrial manufacturing, automotive supply chains, B2B communication equipment, and high-tech/electronics
Also, we are starting to tie quantitative data to financial data. One of our first attempts is to tie the quantitative data from the Supply Chain Planning survey to the progress on the Supply Chain Index. The gloves are off. We think that it is time to tie quantitative data to choices in corporate technology investments. Unlike other analyst firms, we can call a spade a spade. We are independent and data driven. We will be doing this for the first time in this survey. We would love your input.
As with all of our surveys, all responses are kept confidential. And, if you participate, we will be glad to give your team an one hour overview of the data with a custom cut of the Supply Chain Index. The summary results will be published in our June newsletter.
We want to help you and your team get to the next level of performance. We know that discipline and perseverance pays off. <I hope that it does for me also. Will I see you at the finish line at Key West when I finish my first Olympic triathlon?>