This weekend, I edited the Supply Chains to Admire report. The report was scheduled to publish in the summer of 2023, but life got in the way. The full report publishes this week. I laugh that writing the report is like a root canal. An analysis of improvement, performance, and value of over 500 public companies in 28 industries over a decade. (I posted my working summary.) However, writing it is a great time to get into industry patterns and think.
With surgery, I just never got to the report finished. Writing it takes weeks. In retrospect, I am glad that I did not publish it in the summer. Working on it over the holiday break, allowed me to spend more time to think about the trends that I am seeing in the data. Here, I share four in advance of the full study.
- Smaller Focused Companies Win. When compared to the peer group performance, smaller and regional players outperform larger companies. The gaps widened in the past five years. This happened pre-pandemic.
- Customer-centric Innovation Drives Value. Intuitive Surgical, L’Oreal, and Sleep Number drove excellence through product and service innovation to outperform their peer groups.
- Planning Needs to Change. In the past five years, companies have 5-10X the number of AGVs in their warehouses, but 40-60% more planners in corporate. We have successfully reduced warehouse labor, but planning is more labor intensive today, and less effective.
- Performance Declines. The performance of large global branded companies with extensive IT portfolios shows decline. Let’s take a look at Kellogg and Kimberly-Clark in Figure A. Kimberly-Clark, in 2022, finished the year at 13% margin and 6.15 turns compared to 13% margin and 6.89 turns in 2013. Kellogg posted 19% margin in 2013 and 6.96 turns in 2013 but fell to 11% margin and 6.05 turns in 2022.
Figure A. Orbit Charts for Kimberly-Clark and Kellogg for 2013-2022
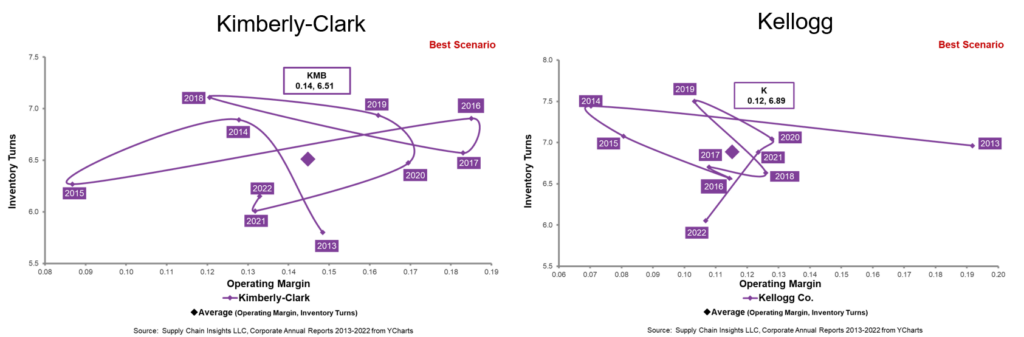
A good friend of mine, asked, “Isn’t this the impact of the pandemic.” My answer is, “I don’t think so. Look at the circular pattern of the results.”
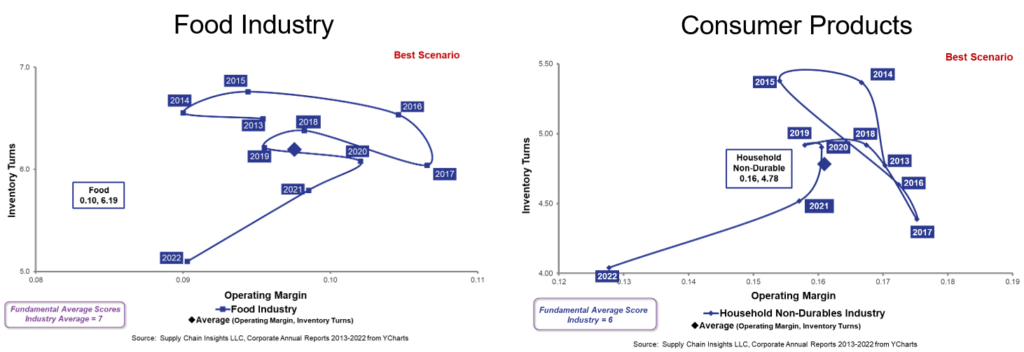
Compare the results to the industry trends. No company in either the household non-durable (consumer goods) or the food manufacturing group beat their peer group on the balanced scorecard of growth, inventory turns, operating margin, and Return on Invested Capital (ROIC) for 2013-2022. The paradigm needs to change to buck the trend. (Note to the reader: we selected these metrics for the balanced scorecard for the analysis after work with Arizona State University to understand which metrics, in combination, most closely correlated with market capitalization. This work completed in 2013 defined the Supply Chains to Admire. We are currently working with the statistics group at Georgia Tech to understand how the relationship of these metrics changed over time, but more on that in a later blog.)
My reply to my friend is that “The supply chain is a complex non-linear system. I think that the circular pattern we see is a system out of control.” The larger the company, and the greater the complexity, the more issues in keeping the metrics balanced to drive improvement and outperform the peer group. Look at the industry decline in Figure B. All companies in the sector are struggling. (Check out more orbit charts and preparation files for the report in the summary powerpoint.)
Figure B. Industry Trend at the Intersection of Operating Margin and Inventory Turns for 2013-2022
My conclusion? I think that we are trying to manage an out-of-control system. I believe that the techniques of the 1990s work for regional companies, but not the large and more complex branded companies. I struggle to find any company greater than 1B$ in annual revenue, that has implemented digital transformation initiative, from any technology company, that has sustained performance to peer group over a decade. As a result, to drive improvement and outperform, I think that we must rethink our paradigms.
Which leads me to share an article that I think that every supply chain leader should read. The focus of the writing by Donella Meadows is on managing leverage points in a system to drive change. Donnella, now deceased, was a student of Jay W. Forrester that first identified the bullwhip effect in 1961. (Today, we acknowledge the bullwhip concept, but no company manages it or minimizes the impact.) Unfortunately, most people in a company see the supply chain as a linear set of flows to be consumed, not as a complex system. I like the quote from the European Journal of Operational Research on JW Forrester’s work:
“The trouble with systems thinking, is it allows you to misjudge a system. You have this high-order, nonlinear, dynamic system in front of you as a diagram on the page. You presume you can understand its behavior by looking at it, and there’s simply nobody who can do that” (Fisher, 2005).
European Journal of Operational Research, Volume 263, Issue 1, 16 November 2017, Pages 240-246Donella writes that the way to interact and change a complex system is through twelve leverage points listed in ascending importance below. For each of Donella’s leverage points, I share Lora’s interpretation for supply chains in parenthesis. These are not exhaustive in descriptions, just thoughts to jumpstart your thinking.
Leverage Points:
- Constants, parameters, numbers. (In the case of supply chain, think about lead times, conversion rates, and cycles.)
- The sizes of buffers and other stabilizing stocks relative to their flows. (The supply chain has two important buffers–inventory and capacity. In most companies with a high asset utilization, there is no practical way to buffer through asset capacity. So, the design of the inventory buffer is the most important. Still, only 9% of companies design their inventory buffers, and few companies include the impacts of lead time variation in safety stock determination.)
- The structure of material stocks and flows. (Think about physical network design. The number of nodes and flows.)
- The length of delays, relative to the rate of the system change. (Demand latency (channel consumption to order placement) increased with product proliferation 50-125%. Data latency increases with outsourcing by 1-2 days. Most companies do not actively design flows.)
- The strength of negative feedback loops, relative to the impacts they are trying to correct. (Consider the role of functional metrics and the lack of alignment with the corporate scorecard.)
- The gain around driving positive feedback loops. (In this area, I focus on bonus incentive systems and the alignment with the system).
- The structure of information flows (Who does and does not have access to information. This probably needs no narrative. However, in the pandemic, companies with descriptive analytics performed better than peers.)
- The rules of the system. (Consider job tenure, penalties, and fees.)
- The power to add, change, evolve or self-organize system structure. (Any takers here? I find this incredibly hard for organizations.)
- The goals of the system. (Few companies are clear on the definition of supply chain excellence and the focus on functional metrics throws the system out of balance.
- The mindset or paradigm of the system. (For the supply chain, in most organizations, the focus is on the efficient and connected organization. Few manage flows or recognize multiple supply chain flows.)
- The power to transcend paradigms. (This leads me to question the need for outside-in systems. I hope that you have time to read our new report.)
Encourage your organization to be system thinkers and challenge convention. Focus on these twelve leverage points to drive improvement. This is what we will do in our upcoming course on building outside-in planning competencies. I would love to have you and your team join the class. The format is virtual: one class a week for five weeks. There will be two classes. Each company can place two students in the class. One will be for the Americas on Monday mornings and one for Europe/Asia (7:00 EST) on Wednesdays. The two classes will have the opportunity to network and share open microphone time for Q&A on Fridays. Those completing all of the homework and activities will have the opportunity to join the group that is testing outside-in processes. There is no charge. In my own way, I am trying to break the cycle.
The reason? Today, there is just too much waste–waste of time, waste of labor (planners struggling to make progress), waste of inventory and cash (inventory sitting that is not being used), waste of assets and materials (as we landfill the products that are not sold), and waste of transportation to move products that are not needed. As we think about ESG imperatives, we need to think past better math in traditional models to redefine the taxonomies of how the models work together to redefine work. As an environmentalist, I am trying in my own way to make things better. Once you see the supply chain through the lenses of demand streams and flow, you cannot unsee it.