It started at my kitchen table. I was writing the book, Bricks Matter and I wanted a better definition of Supply Chain Excellence. As a member of the team at AMR Research that defined the AMR Top 25 Methodology, I was frustrated in the execution of what I thought could have been a good thing. (For the reasons why, please read my recent blog post)
I believed that there was a strong tie between supply chain excellence and corporate performance. I wanted to find out more. It has turned into a twelve-month research project. It has not been easy. We will share our final results at our upcoming Global Summit on September 11th and 12th at the Phoenician in Scottsdale, AZ.
The Building of the Index
We started with mining the data on supply chain financial ratios within industry groups. This research was the backbone of the Supply Chain Metrics that Matter series of reports.
As we did this analysis, I was amazed. Very few companies had made progress on what I came to term the Supply Chain Effective Frontier (orchestrating the trade-offs between growth, profitability, cycles and complexity). Managing the supply chain as a complex system with finite trade-offs was something that few had mastered. Many companies, to my surprise, were going backwards.
While billboards tout that companies can improve performance by implementing software XZA and consultants claim that best practices result in improved performance of QRP, I found out that most companies were stuck. The pretty world described by technology and consulting companies is not today’s reality. The unfortunate truth is that many companies are unable to power forward and make the trade-offs between profitability, complexity and supply chain cycles. The missing link is often leadership.
As we published more and more industry data, I wanted to better define industry leaders. I yearned to know who had done it the best. It was then, that I started the research effort to correlate financial ratios to six years of market capitalization data by Morningstar sector. We currently have two full-time researchers working on this project augmented by a summer intern. The question is simple but the answer is not.
I find that when I share the results with supply chain teams, that most companies have not held themselves accountable to balance sheet results. Instead, they have measured functional metrics or focused on projects. And, while the projects have achieved returns, or while a function had driven improvements, these business results have not translated into improvements on the balance sheet.
In the future, it is our goal to start to tie insights from this research to our quantitative maturity models. We will begin this work following the launch of the Supply Chain Index and the sharing of the industry results at our Global Summit. Here I share my insights.
What can we Learn from the Index?
The work has been harder and more difficult than I originally thought. We are sharing insights on the work through monthly webinars. Check them out!
Here are the questions that I normally get:
Where is Customer Service in the Analysis? I believe that customer service is a critical metric and a key element of managing a complex supply chain system. The unfortunate thing is that there is not good data in the market for customer service. As a result, I could not use it in the development of the Index.
What do I mean? When I was an analyst at AMR Research, I worked with Debra Hoffman to benchmark over ninety companies. The first thing that we learned is NEVER depend on self-reported customer service forecast accuracy data. Why? There is no consistent methodology for reporting and companies invariably introduce a positive bias. Companies overreport (embellish) the results. I found that it is a lot like a woman reporting her weight on her driver’s license.
As a result, I never use the APQC data in my research, and I discount the popular consulting reports (Accenture, AT Kearney, PWC and SAP reports) that use self-reported data.
So, while I would like to have customer service in the index, there was no good source of data. As a result, I built the Index based solely on balance sheet and income statement data.
Why Morningstar sectors versus SIC codes? The market capitalization data is grouped by Morningstar sectors and we wanted to build something that would enable supply chain discussions to finance groups in a more meaningful way. Unfortunately, many companies do not easily associate that the other companies in their Morningstar peer groups are their natural competitors. The association requires some education.
However, when we share the methodology, all agree that it is better than throwing all industries into one spreadsheet and shaking them up.

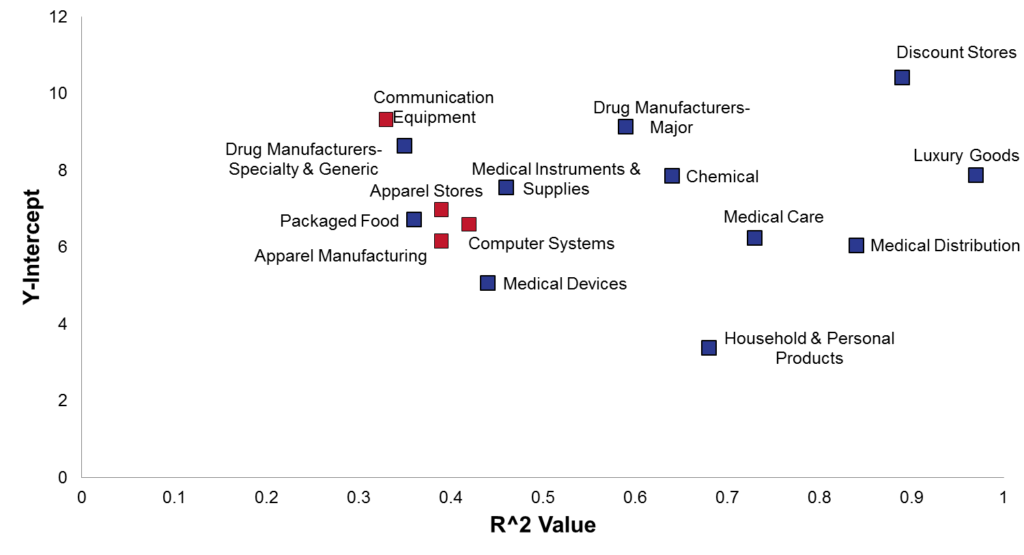
Why look at so many industries? Don’t the patterns in the industries mirror each other? The differences between industries surprises even an old supply chain gal like me. For example, in figure 1, contrast the difference in rankings between R^2 (the degree of correlation) and the Y-intercept of the models. The smaller the Y-intercept the greater the impact of supply chain on market capitalization and the larger the R^2 value the better the fit of the model. The largest impact on market capitalization through supply chain excellence is Household Products. The more that companies are driven by product innovation, the lower correlation with supply chain financial ratios and the greater the need to integrate supply chain processes with the stage gate evolution in product development.
There are many drivers of market capitalization other than supply chain. Why are you using it as an objective function? We know that there are many factors that drive market capitalization. We are surprised to find that the impact is as great as it is. If there was a better objective value, we would have used it.
I also understand that the goal of a supply chain team may not be to maximize market capitalization. My goal is to help them to better make a conscious choice. I want supply chain teams everywhere to understand the metrics that matter to market capitalization. I also want to share the understanding of the impact of performance from individual metrics and the need to manage the metrics as a balanced portfolio.
Who has done it best? To get this answer, you will need to come to our conference. We hope to see you there! Check out my recent post on the Supply Chain Insights blog to understand the seven reasons that you should attend.

Reflection: The Journey to be Market Driven
In 2002, I had the opportunity to work with General Mills. I walked away thinking, “What a great company!” At that time, the sales organization