BASF creates chemistry. Over the last two decades the company successfully leveraged global scale to define supply chain leadership. With 12,000 supply chain employees operating in 80 countries with 2400 storage facilities, supply chain excellence and innovation are the foundation of corporate performance. The work of the BASF leadership team is a success story in managing global complexity.
 For this case study we interviewed Ralf Busche, Senior Vice President of Global Supply Chain Strategy and Performance. Ralf has worked at BASF since 1989 in a variety of jobs across continents. He is an industrial engineer with a diploma in transportation and logistics from the University of Applied Sciences in Bremerhaven.
Our goal in writing these case studies is to share insights from the Supply Chains to Admire winners from 2016. Here we share the interview with Ralf.
About the Supply Chains to Admire Research
Over the period of 2009-2015 only 88% of companies made improvement on the “Supply Chain Metrics That Matter.” (The Supply Chain Metrics That Matter are a portfolio of metrics which correlate to higher market capitalization. The composite of metrics includes growth, operating margin, inventory turns and Return on Invested Capital.) While most companies make improvements in single metrics, pushing the whole portfolio forward is tougher.
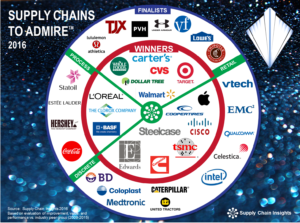
In the analysis for the 2016 Supply Chains to Admire, companies needed to score better than their peer group average for performance metrics, while driving a higher level of improvement than 2/3 of their industry peer group. In our analysis BASF outperformed their chemical industry peers while driving improvement at a 60% level when compared to the peer group.
To make the Supply Chains to Admire list, the calculation process is:
• Improvement as Measured by the Supply Chain Index. The first step in the process is the calculation of the Supply Chain Index, to measure supply chain improvement, for an industry peer group. We group companies by NAICS codes to study year-over-progress at the intersection of operating margin and inventory turns. A ranking in the top 2/3 of the peer group qualifies a company for further analysis. We eliminate the lower 1/3 of companies for the period from consideration. Note in Figure 1 that BASF drove great improvement in the period of 2009-2013, but then slowed in 2014-2015. This trend was characteristic of the chemical industry. BASF is at the upper end of the improvement spectrum for the chemical industry. (Companies with highest performance struggle to drive improvement at the rate of lower performing companies.)
• Value, i.e. Price to Tangible Book Value (PTBV). This analysis determines which companies are driving the greatest value. To complete the analysis, we first eliminate outliers in the PTBV calculation. After the elimination of outliers we include companies that are at or above the PTBV average for the peer group (allowing for no more than 5% below the mean for the peer group to account for rounding errors).
• Performance. Companies passing these two tests are then analyzed against the performance factors for 2009-2015:
- Growth. Higher percentage growth than the industry average.
- Operating Margin. Greater margin performance than the industry average for the peer group for the period studied.
- Inventory Turns. Better performance in inventory turns than the peer group average for the period studied.
- Return on Invested Capital (ROIC). Higher performance on ROIC than the average for their peer group for the period.
Determination of the winners.
In the analysis of the performance factors, we group companies into two classifications:
• Supply Chains to Admire Winners. In the analysis of the performance factors of growth, operating margin, inventory turns, and Return on Invested Capital, Supply Chains to Admire winners score at or above the industry peer group average for all four of the factors. (Must be within 5% of the mean of the peer group to account for rounding.)
• Supply Chains to Admire Finalists. Companies meeting the Supply Chain Index and the PTBV criteria, but falling below the peer group averages on the performance factors, rank as finalists if they are no more than 10% below the industry average for three out of four of the performance factors, and no more than 25% below on any single performance factor. In the period of 2009-2015 BASF drove significant improvement in operating margin through the redefinition of supply chain processes post-recession. As shown in Table 1, the averages for BASF for the Supply Chain Metrics That Matter are significantly better than their peer group.
Figure 1. Orbit Chart of Supply Chain Performance at the Intersection of Operating Margin and Inventory Turns for the Period of 2006-2015
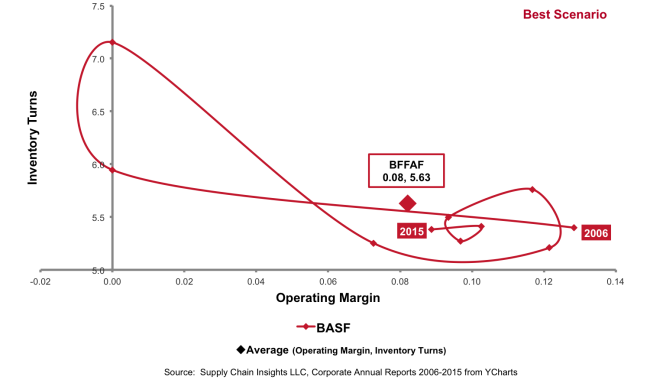
Table 1. Comparison of Performance and Improvement of Companies in the Chemical Industry for 2009-2015

Ralf’s Insights
To understand BASF’s approach, we asked Ralf Busche to reflect on their journey and share his insights.
What enabled you to drive the higher levels of performance versus peer group?
A dual-mode approach drove success. This includes: Operate to Excellence and Design for Growth. Let me take each one and explain it.
- Operate to Excellence: We increased process effectiveness and efficiency through multiple SC Shared Service initiatives that improved customer experience, costs and agility. To be more precise, we further bundled our customer service activities, harmonized processes and enhanced customer service officers’ capabilities. The related service culture transformation program engaged the employees and led to a noticeable improvement of performance and customer satisfaction. As part of the Shared Service initiatives, we also focused on administrative and physical logistics, set up in one service delivery organization. For example, this included transport management, export management, as well as customs and foreign trade.
- Design for Growth: Innovation, and increasing the speed of digitization, drives value in the end-to-end supply chain. We see the future of supply chain as being fully transparent, digitized and connected. Sustainability is also important. As a consequence, we work on the digital transformation of BASF’s supply chain and address the characteristics through projects like horizontal integration, logistics visibility, and advanced business analytics.
At the same time we built a strong innovation culture and expanded our expertise across various disciplines, including mathematicians and data scientists, to reach the next maturity level.
It did not happen overnight. Throughout the last two decades BASF developed its supply chain in an evolutionary manner. We are complex. BASF consists of about 80 different business units serving almost all industries across the globe under a “one company” approach. This required an advanced operating model that clearly defines roles and responsibilities for the business units, Supply Chain Shared Services and Supply Chain governance.
 One of our first focus areas was global governance. As part of our governance effort, we have formed a leadership council that includes all relevant stakeholders and meets regularly to review the actual performance, decide on important projects, and shape the strategic direction of BASF’s supply chain. As part of our strategic roadmap, we segmented our businesses in three distinguished Supply Chain Models: Lean, Capable, Agile.
These models describe the typical characteristics of SC Services per segment, mapped all BASF business units according to this segmentation, and captured their specific service requirements. With differentiated SC services, we are now in the process of designing and implementing a comprehensive concept for transactional services to our customers.
In the Process, What Did You Learn?
Leading a supply chain requires outstanding competencies. Besides the obvious functional expertise in transportation, warehousing, inventory management and production planning, today’s Supply Chain leaders need a strong business acumen, global orientation, technical savvy and influential leadership skills to master the increasingly pivotal supply chain responsibility. I worked in Hong Kong for 4 years during 2009 to 2013. During that time I learned that technical capabilities are generally available inside and outside BASF, however business and leadership skills were often lacking so that many businesses were unable to fully leverage their potential.
What About the Future? What Do You Think Are the Important Trends? Throughout the last decade we have continuously looked for innovative trends and the latest developments in Supply Chain based on our close cooperation with business partners, institutions and universities. That includes network optimization, warehousing solutions, as well as smart process automation. We know the future of supply chain is fully transparent, digital, connected, and sustainable. To continue this work, BASF started an initiative called “BASF 4.0” which focuses on digitization focusing on sourcing, manufacturing, sales & marketing and supply chain. We already detected various opportunity fields e.g., in predictive maintenance, digital business models as well as predictive planning using new technologies and business analytics. We are very excited about business analytics. The results get a lot of attention. We have already built a dedicated cross-functional team with experts from different areas providing solutions for better decision making in all business areas.
Looking Forward
At Supply Chain Insights, we are getting ready to start work on the Supply Chains to Admire for 2017. This is our fourth year of mining supply chain ratio data to understand the patterns. In the process, we are open on the methodology and welcome input. Our goal is to develop a data-driven standard that can help all supply chain leaders.
The results of the Supply Chains to Admire will publish in June 2017. We will invite the winners to speak at the Supply Chain Insights Global Summit . We are capturing case studies like the BASF’s for our 2018 book on supply chain leadership.